Option-Model Visual Report
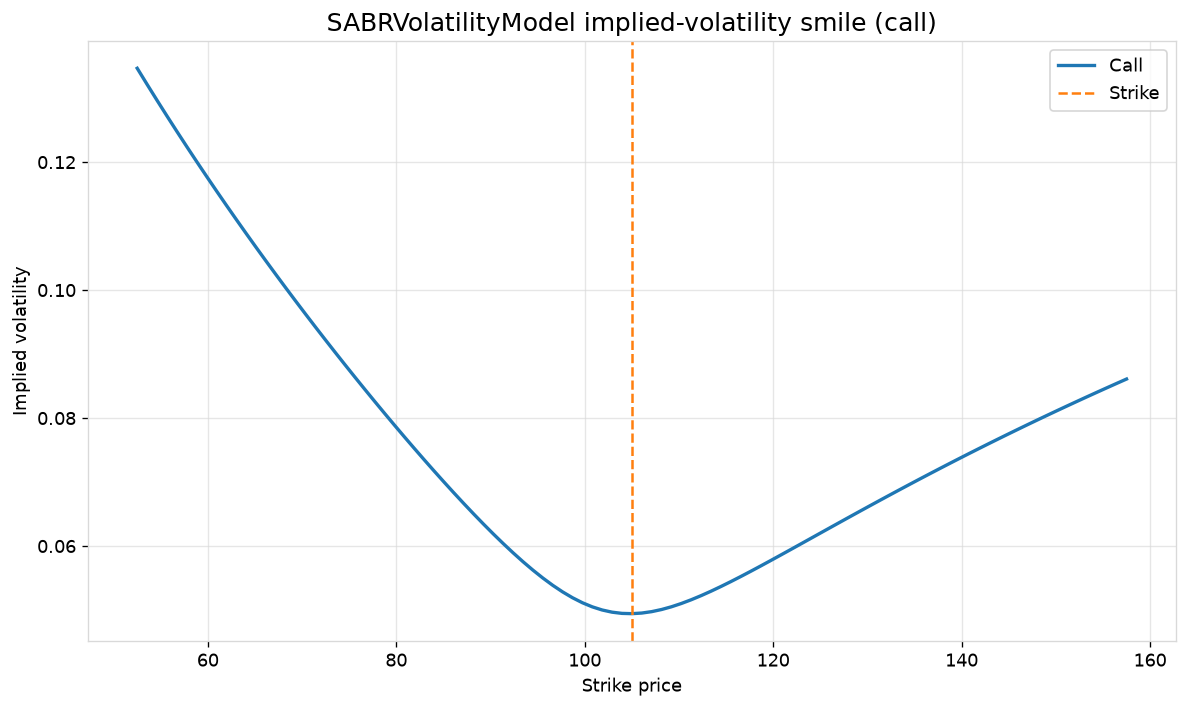
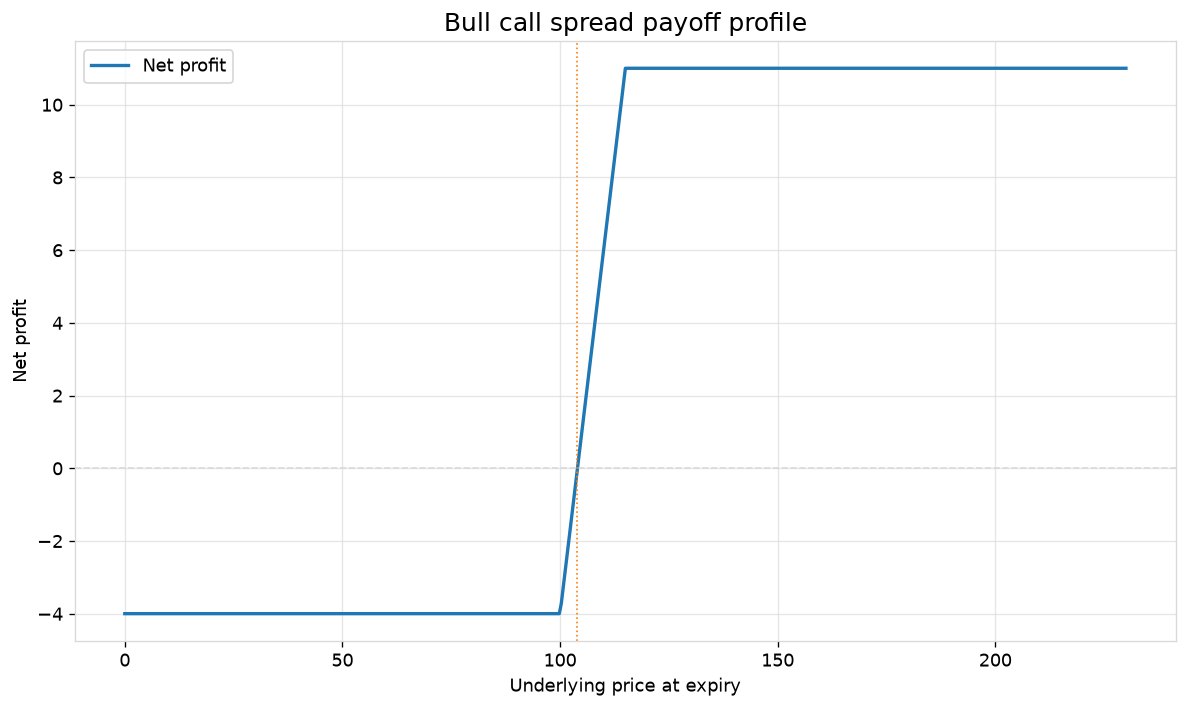
This notebook assembles a compact, presentation-ready set of figures for one option position: Black–Scholes call and put payoffs, a value profile, extrinsic value, standardized Greeks, price and extrinsic-value surfaces, a binomial lattice put, a SABR volatility smile, and a strategy payoff — all built from the same underlying market inputs.
Sections:
Build the models
Numerical diagnostics
The figure set
Setup
import abaquant
print(f"AbaQuant version: {abaquant.__version__}")
AbaQuant version: 1.0.0rc1
from abaquant.derivatives import OptionStrategy
from abaquant.derivatives.models import BlackScholesMertonModel, CoxRossRubinsteinModel
from abaquant.derivatives.models.sabr import SABRVolatilityModel
from abaquant.visualization import VisualizationError
1. Build the models
A Black–Scholes model, a binomial lattice, and a SABR smile — all sharing spot=100, strike=105, T=1y.
models = {
    "black_scholes": BlackScholesMertonModel(100.0, 105.0, 1.0, 0.05, 0.22),
    "lattice": CoxRossRubinsteinModel(100.0, 105.0, 1.0, 0.05, 0.22, number_of_steps=8),
    "sabr": SABRVolatilityModel(100.0, 105.0, 1.0, 0.20, 0.7, -0.25, 0.45),
}
2. Numerical diagnostics
The scalar values that correspond to the figures below.
report_values = {
    "bsm_call_price": models["black_scholes"].call_price(),
    "bsm_put_price": models["black_scholes"].put_price(),
    "bsm_call_extrinsic_value": models["black_scholes"].extrinsic_value("call"),
    "bsm_call_moneyness": models["black_scholes"].moneyness(),
    "bsm_call_forward_moneyness": models["black_scholes"].forward_moneyness(),
    "bsm_call_break_even_price": models["black_scholes"].break_even_price("call"),
    "lattice_put_price": models["lattice"].put_price(),
    "sabr_atm_iv": models["sabr"].implied_vol(),
}
for key, value in report_values.items():
    print(f"{key:30s}: {value:.6f}")
bsm_call_price                : 8.814354
bsm_put_price                 : 8.693444
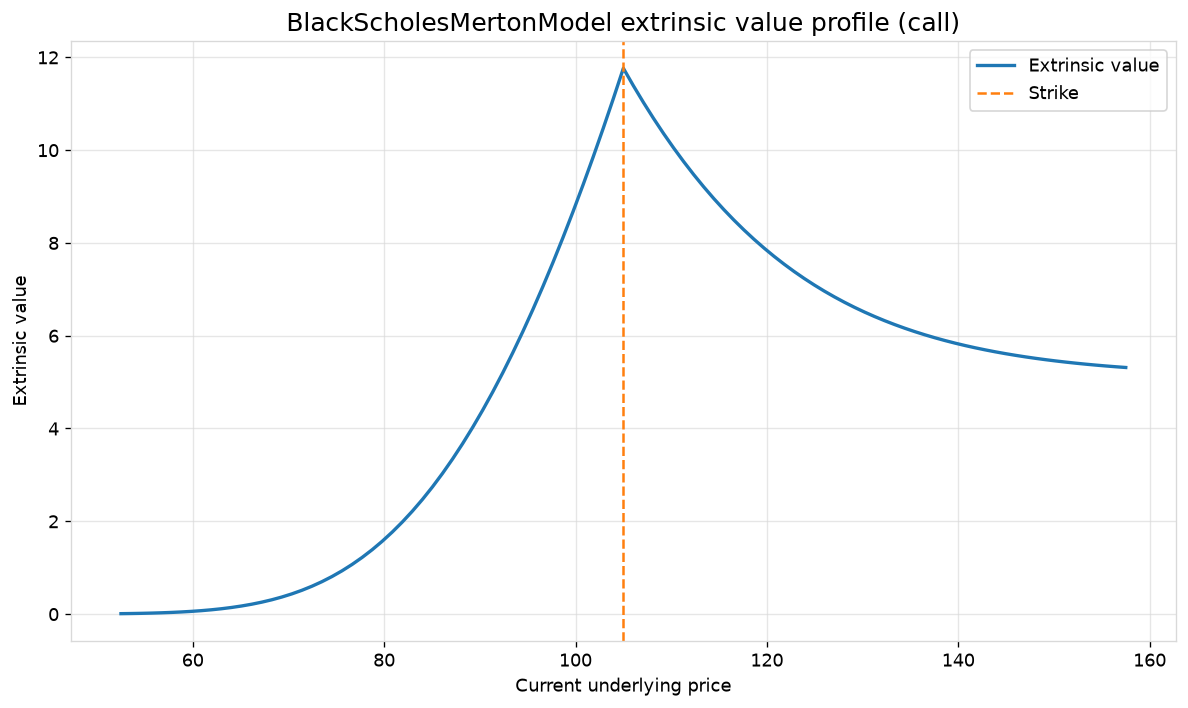
bsm_call_extrinsic_value      : 8.814354
bsm_call_moneyness            : 0.952381
bsm_call_forward_moneyness    : 1.001211
bsm_call_break_even_price     : 113.814354
lattice_put_price             : 8.864647
sabr_atm_iv                   : 0.049417
3. The figure set
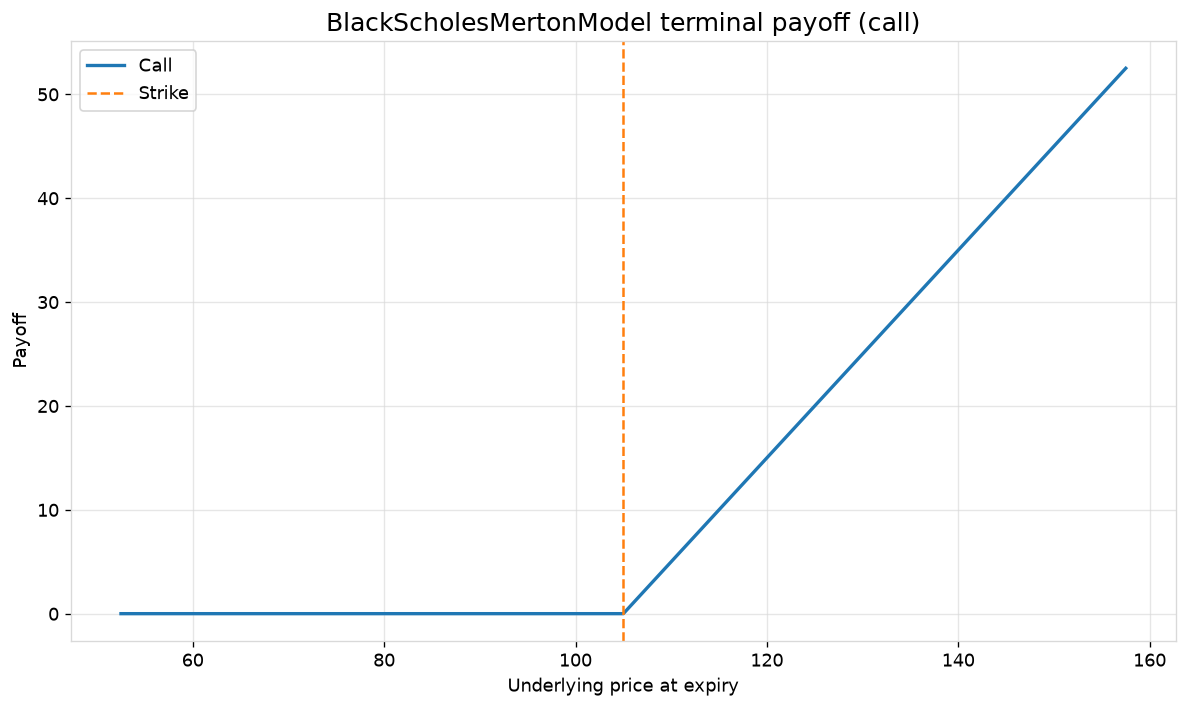
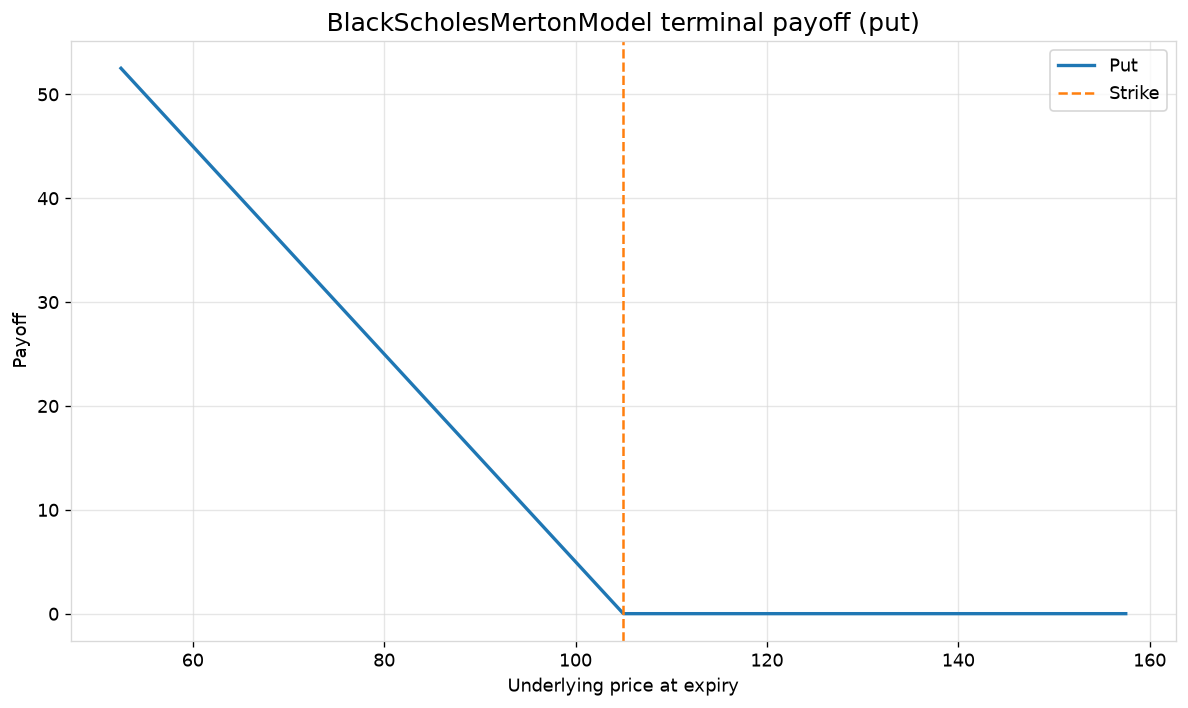
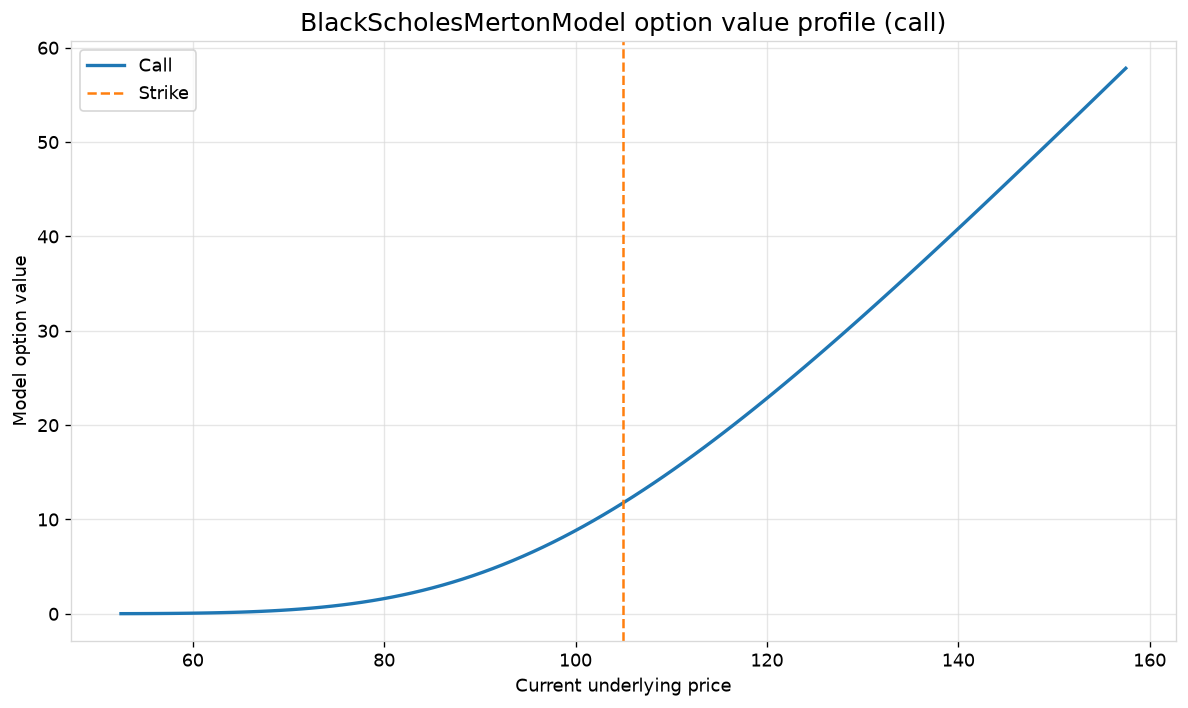
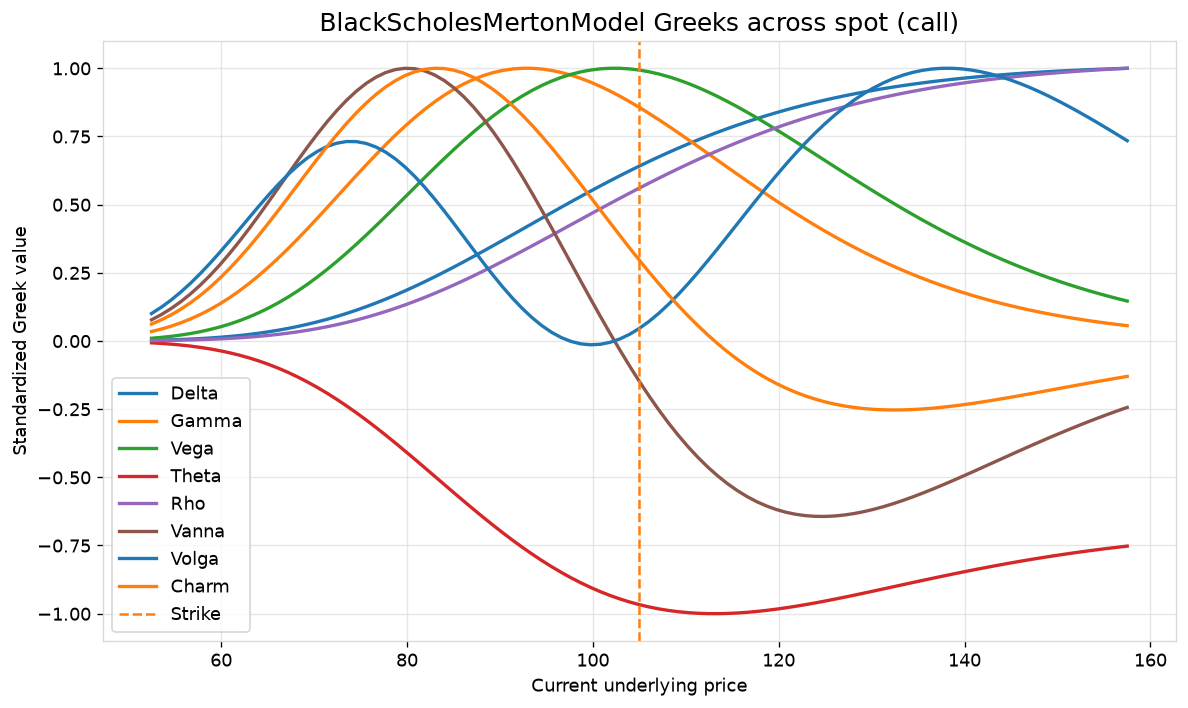
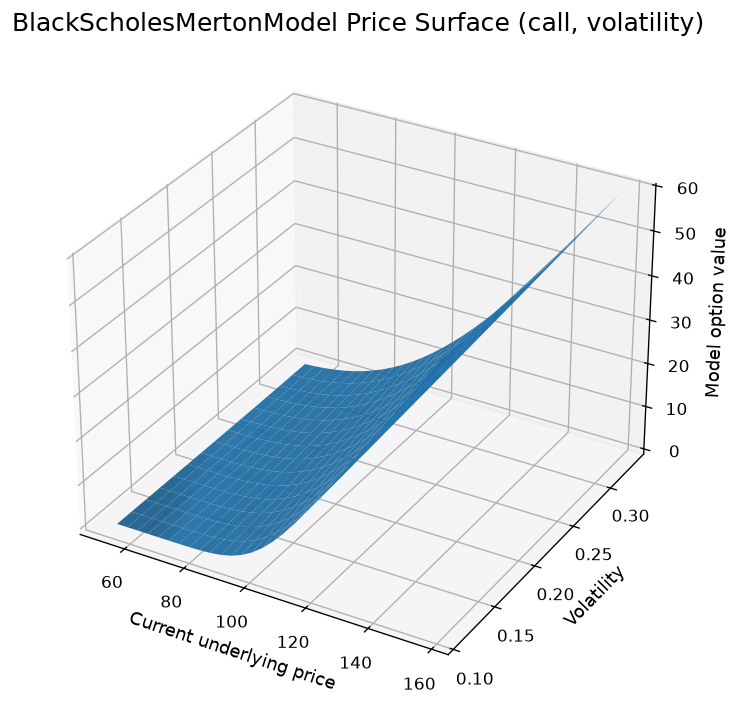
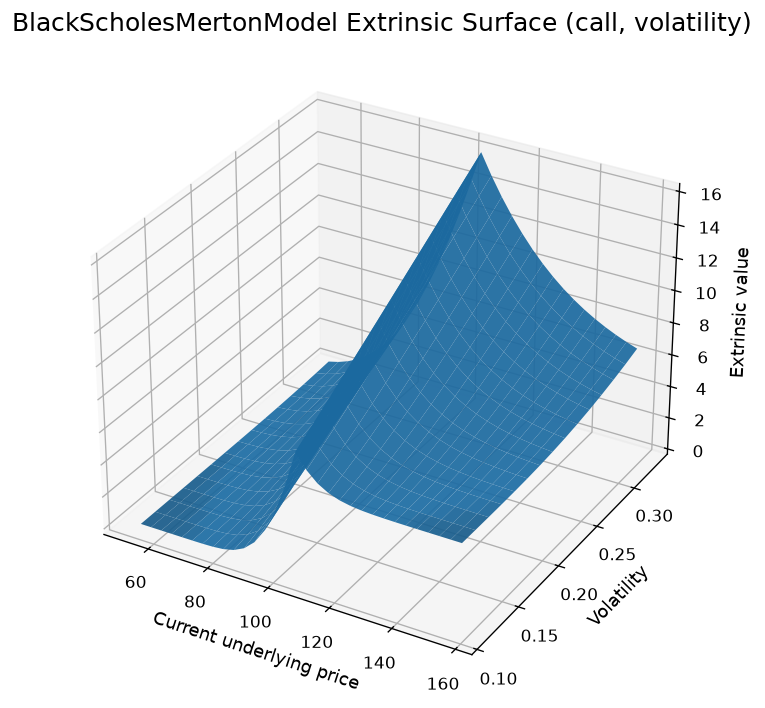
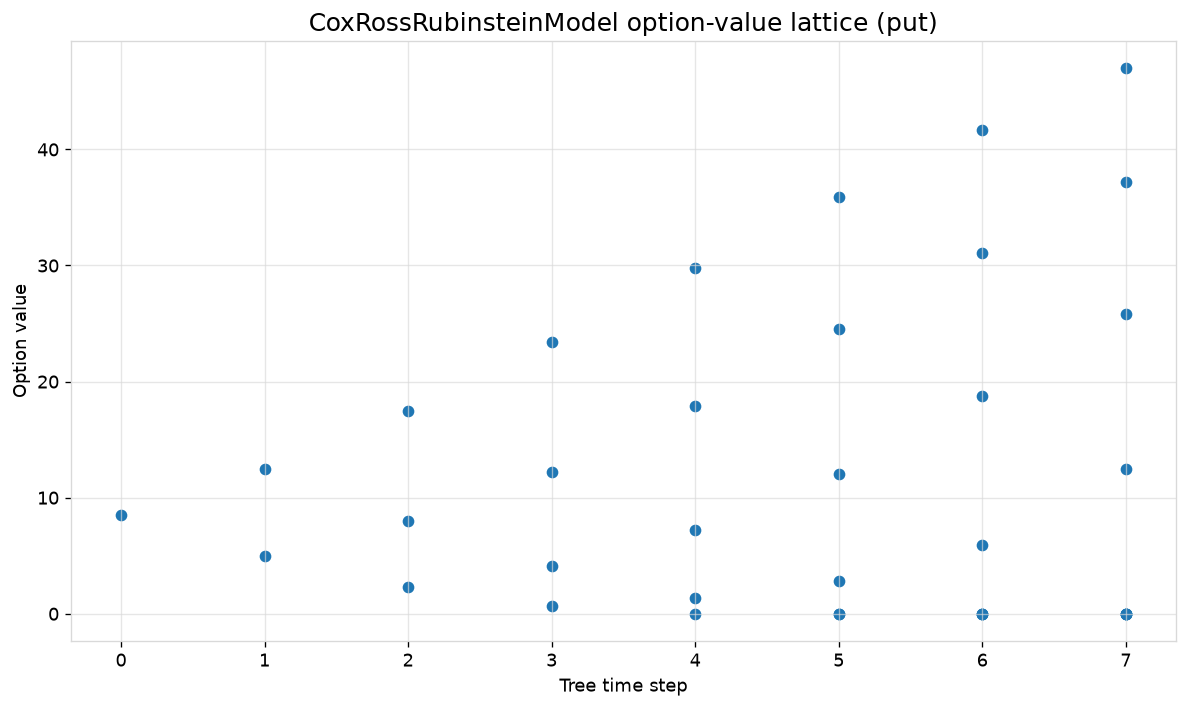
Eleven figures covering payoff, value profile, extrinsic decomposition, Greeks, surfaces, the lattice, the SABR smile, and a strategy payoff.
try:
    figures = {
        "call_payoff": models["black_scholes"].visualize(chart="payoff", option_type="call"),
        "put_payoff": models["black_scholes"].visualize(chart="payoff", option_type="put"),
        "call_value_profile": models["black_scholes"].visualize(
            chart="price_profile", option_type="call"
        ),
        "call_extrinsic_profile": models["black_scholes"].visualize(
            chart="extrinsic_value", option_type="call"
        ),
        "call_greeks": models["black_scholes"].visualize(
            chart="greeks", option_type="call", greek_scale="standardized"
        ),
        "call_price_surface": models["black_scholes"].visualize(
            chart="price_surface", option_type="call", grid_size=31, volatility_grid_size=15
        ),
        "call_extrinsic_surface": models["black_scholes"].visualize(
            chart="extrinsic_surface", option_type="call", grid_size=31, volatility_grid_size=15
        ),
        "put_lattice": models["lattice"].visualize(chart="tree", option_type="put"),
        "sabr_smile": models["sabr"].visualize(chart="volatility_smile"),
        "strategy_payoff": OptionStrategy.bull_call_spread(
            lower_strike=100.0, upper_strike=115.0, lower_premium=6.0, upper_premium=2.0
        ).visualize(chart="payoff"),
    }
    print(f"Created {len(figures)} figures: {list(figures)}")
except VisualizationError as exc:
    print(f"Visualization skipped (optional dependency missing): {exc}")
Created 10 figures: ['call_payoff', 'put_payoff', 'call_value_profile', 'call_extrinsic_profile', 'call_greeks', 'call_price_surface', 'call_extrinsic_surface', 'put_lattice', 'sabr_smile', 'strategy_payoff']
Takeaway
This is a good template for a one-position “tear sheet.” Combine it with
model.report(option_type=...) (see notebook 21 — Exportable Reports)
to turn the same diagnostics into a Markdown/HTML/PDF deliverable.