Portfolio Backtesting
AbaQuant’s backtesting layer evaluates periodic simple-return panels, applies transparent target weights, rebalances on a fixed calendar schedule, and reports performance, drawdown, turnover, and transaction-cost diagnostics. It is intentionally not an event-driven trading simulator.
Sections:
Build an allocator and run the object-oriented backtest
Run the same backtest through the functional helper
Summaries: performance, costs, monthly returns, drawdowns, contributions, trades
Visualizations
Setup
import abaquant
print(f"AbaQuant version: {abaquant.__version__}")
AbaQuant version: 1.0.0rc1
import numpy as np
import pandas as pd

from abaquant.portfolio import PortfolioAllocator, run_rebalanced_backtest
from abaquant.visualization import VisualizationError

def sample_returns() -> pd.DataFrame:
    dates = pd.date_range("2025-01-02", periods=36, freq="B")
    trend = np.linspace(0.0, 1.0, len(dates))
    seasonal = np.sin(np.linspace(0.0, 4.0 * np.pi, len(dates)))
    prices = pd.DataFrame(
        {
            "ALPHA": 100.0 + 9.0 * trend + 1.8 * seasonal,
            "BETA": 82.0 + 6.0 * trend - 1.2 * seasonal,
            "GAMMA": 54.0 + 3.0 * trend + 0.7 * np.cos(np.linspace(0.0, 3.0 * np.pi, len(dates))),
        },
        index=dates,
    )
    return prices.pct_change().dropna()
1. Build an allocator and run the object-oriented backtest
allocator.backtest(...) accepts a weight policy (here,
inverse_volatility), a rebalance schedule, transaction-cost/slippage
assumptions, and an optional benchmark.
allocator = PortfolioAllocator(sample_returns(), annual_risk_free_rate=0.02)

allocator_backtest = allocator.backtest(
    weights="inverse_volatility",
    rebalance="monthly",
    transaction_cost_bps=5.0,
    slippage_bps=1.0,
    fixed_transaction_cost=1.0,
    initial_capital=100_000.0,
    benchmark="equal_weight",
    lookback=4,
)
allocator_backtest.summary()
{'ending_value': 105670.59605154977,
 'total_return': 0.05670596051549781,
 'cagr': 0.4875443795575871,
 'annualized_return': 0.39759161617094785,
 'annualized_volatility': 0.01769693629033863,
 'downside_deviation': 0.0005270746229309016,
 'sharpe_ratio': 26.419509675967795,
 'sortino_ratio': 887.055379289018,
 'max_drawdown': -8.642685029525143e-05,
 'average_drawdown': -5.805475821304048e-05,
 'calmar_ratio': 5641.121687207597,
 'omega_ratio': 172.32947702415424,
 'best_period_return': 0.003515810977111844,
 'worst_period_return': -6.669185299079672e-05,
 'win_rate': 0.9428571428571428,
 'value_at_risk_95': 6.97823841958601e-06,
 'conditional_value_at_risk_95': -4.321408327329079e-05,
 'skewness': 0.3238484005937596,
 'kurtosis': -1.0722128125190267,
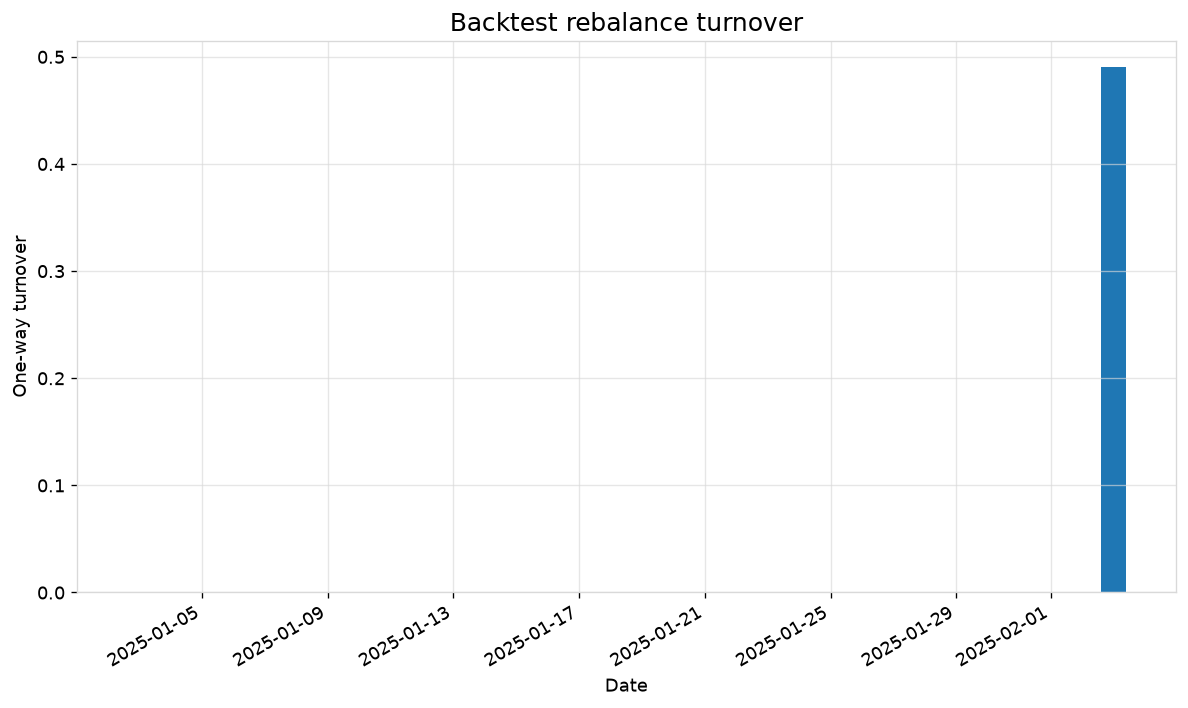
 'total_turnover': 0.4901790097829085,
 'average_turnover': 0.24508950489145426,
 'turnover_events': 1.0,
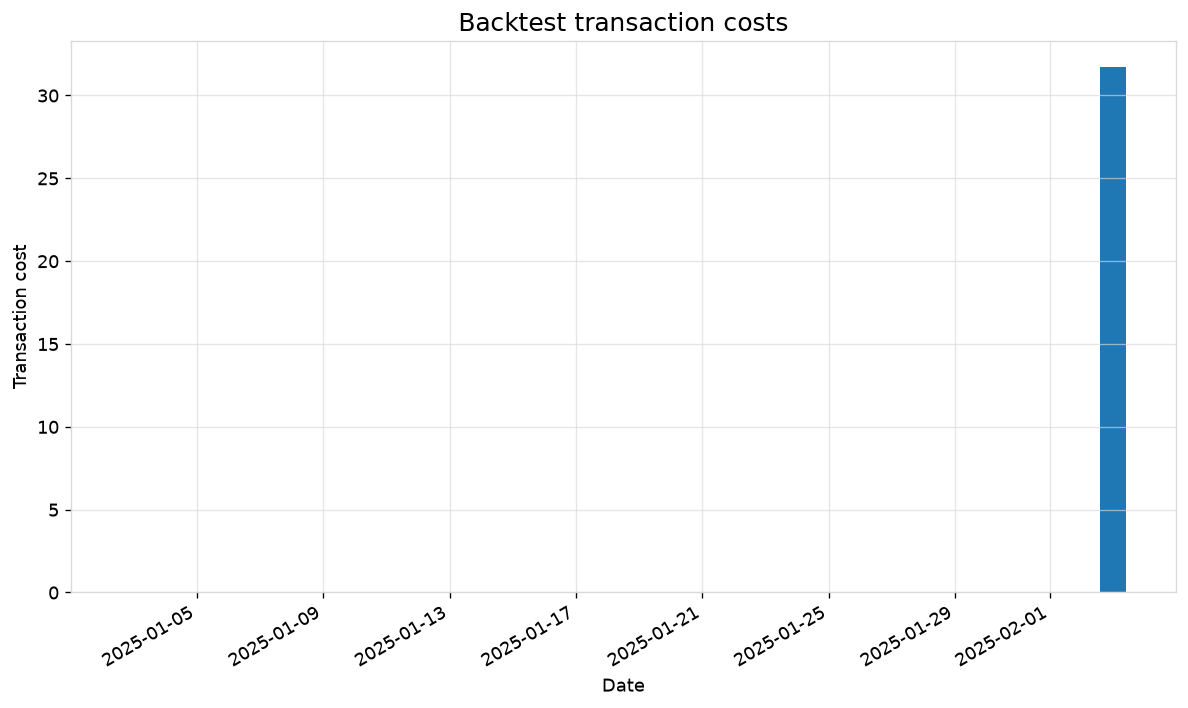
 'transaction_cost_drag': 0.00031700561324870266,
 'total_transaction_cost': 31.700561324870268,
 'benchmark_total_return': 0.06405143200151953,
 'benchmark_cagr': 0.5636187435678752,
 'active_total_return': -0.006903304920331532,
 'tracking_error': 0.005386616339461853,
 'information_ratio': -9.267156641584009,
 'beta': 1.122086166527091,
 'alpha': -0.1424426924647637,
 'up_capture': 0.8884525679130272,
 'down_capture': nan,
 'hit_rate_vs_benchmark': 0.37142857142857144}
2. Run the same backtest through the functional helper
Useful when you want fixed, user-specified weights instead of a policy name.
functional_backtest = run_rebalanced_backtest(
    sample_returns(),
    weights={"ALPHA": 0.45, "BETA": 0.35, "GAMMA": 0.20},
    rebalance="monthly",
    transaction_cost_bps=5.0,
    slippage_bps=1.0,
    fixed_transaction_cost=1.0,
    initial_capital=100_000.0,
    annual_risk_free_rate=0.02,
    benchmark="equal_weight",
)
functional_backtest.summary()
{'ending_value': 107202.72674408721,
 'total_return': 0.07202726744087218,
 'cagr': 0.6499925756051221,
 'annualized_return': 0.5014033290552501,
 'annualized_volatility': 0.01666781355297071,
 'downside_deviation': 0.0,
 'sharpe_ratio': 37.79695360780168,
 'sortino_ratio': nan,
 'max_drawdown': 0.0,
 'average_drawdown': 0.0,
 'calmar_ratio': nan,
 'omega_ratio': nan,
 'best_period_return': 0.0038228763419032585,
 'worst_period_return': 0.0006164770457144364,
 'win_rate': 1.0,
 'value_at_risk_95': 0.0006436517383136886,
 'conditional_value_at_risk_95': 0.000616575166763278,
 'skewness': 0.25439154939214204,
 'kurtosis': -1.2662410576131151,
 'total_turnover': 0.01933594365372518,
 'average_turnover': 0.00966797182686259,
 'turnover_events': 1.0,
 'transaction_cost_drag': 2.2165294349911445e-05,
 'total_transaction_cost': 2.2165294349911444,
 'benchmark_total_return': 0.06405143200151953,
 'benchmark_cagr': 0.5636187435678752,
 'active_total_return': 0.007495723608350158,
 'tracking_error': 0.005861632447920839,
 'information_ratio': 9.19421270050967,
 'beta': 1.0329682141700798,
 'alpha': 0.06845169287243147,
 'up_capture': 1.120428744321768,
 'down_capture': nan,
 'hit_rate_vs_benchmark': 0.6285714285714286}
3. Summaries
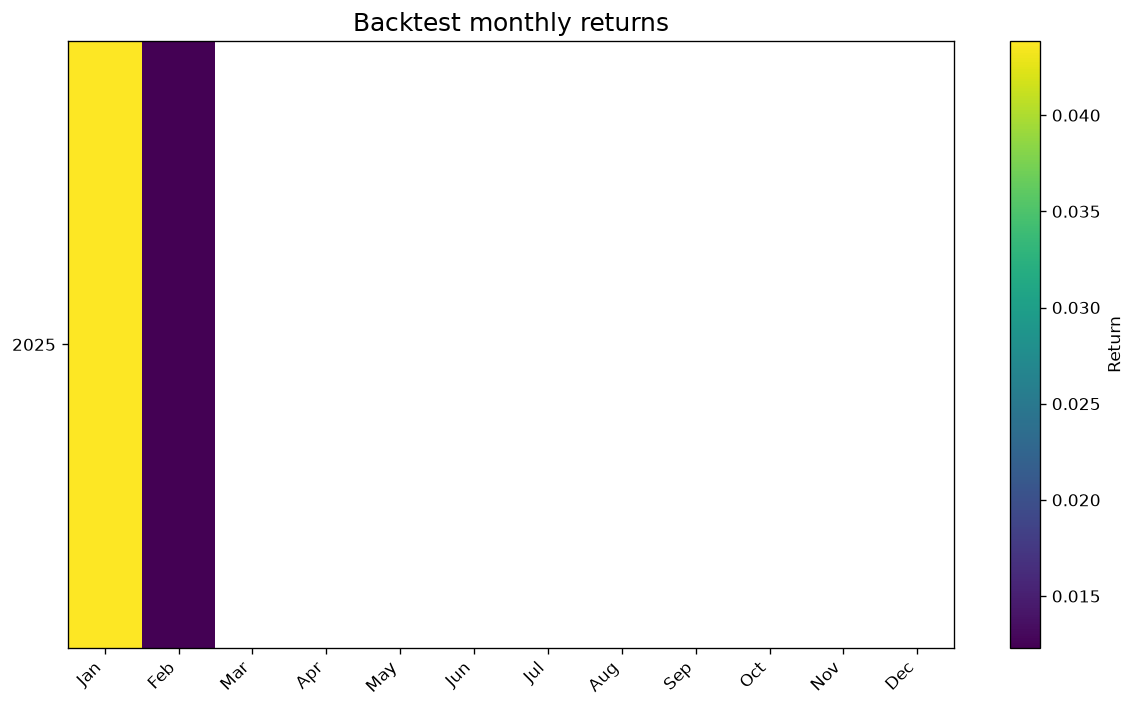
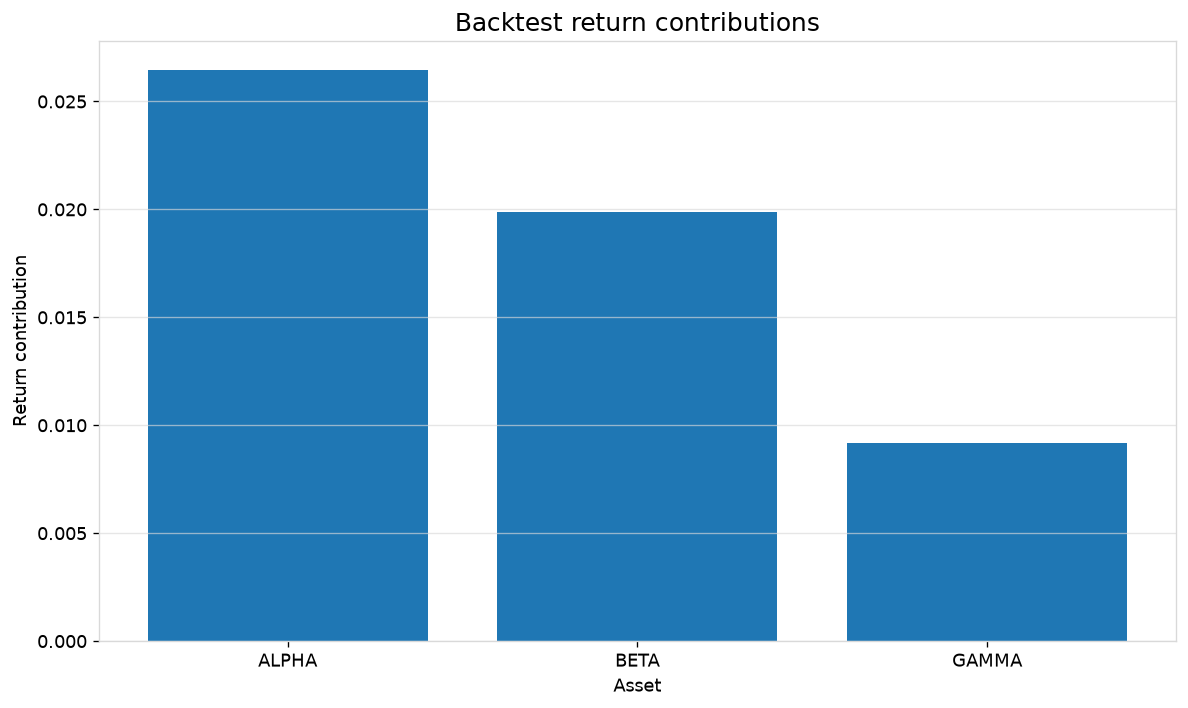
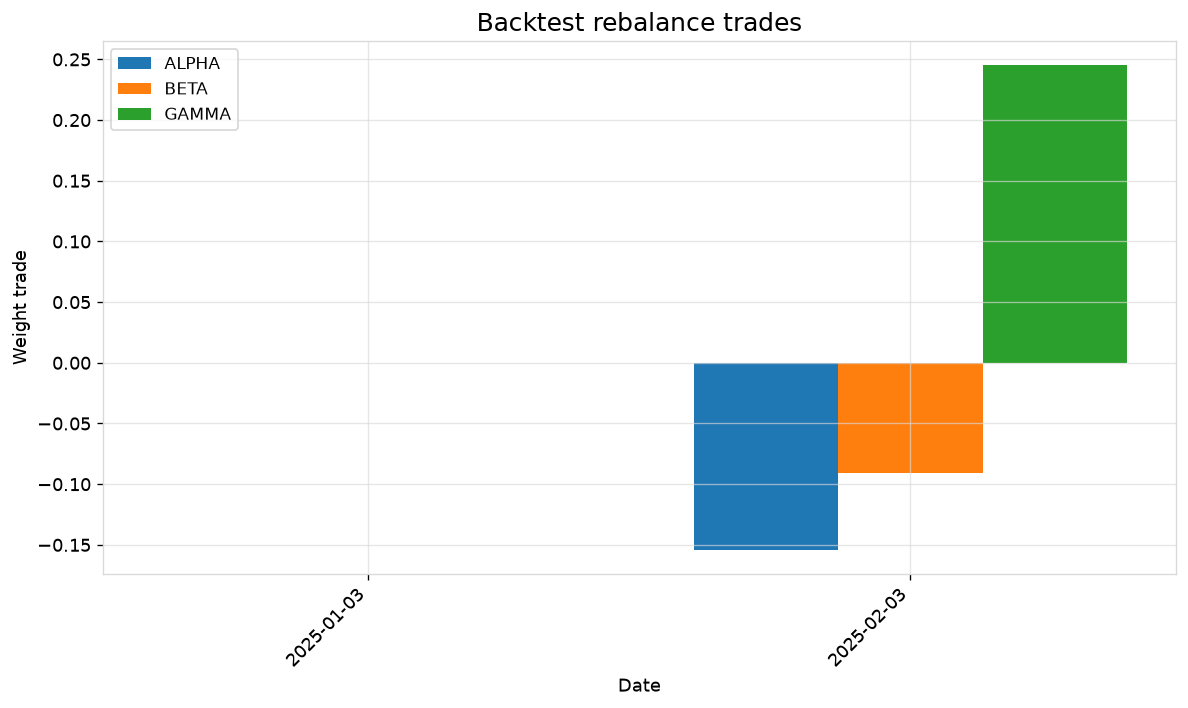
Cost summary, calendar return table, largest drawdown events, per-asset contribution summary, per-rebalance trade summary, and rolling metrics.
allocator_backtest.cost_summary()
{'transaction_cost_bps': 5.0,
 'slippage_bps': 1.0,
 'fixed_transaction_cost': 1.0,
 'total_transaction_cost': 31.700561324870268,
 'transaction_cost_drag': 0.00031700561324870266,
 'average_transaction_cost': 15.850280662435134}
allocator_backtest.return_table()
| Jan | Feb | Mar | Apr | May | Jun | Jul | Aug | Sep | Oct | Nov | Dec | Year | |
|---|---|---|---|---|---|---|---|---|---|---|---|---|---|
| year | |||||||||||||
| 2025 | 0.043855 | 0.012311 | NaN | NaN | NaN | NaN | NaN | NaN | NaN | NaN | NaN | NaN | NaN |
allocator_backtest.drawdown_events(top=3)
| start | trough | recovery | drawdown | duration_periods | recovery_periods | |
|---|---|---|---|---|---|---|
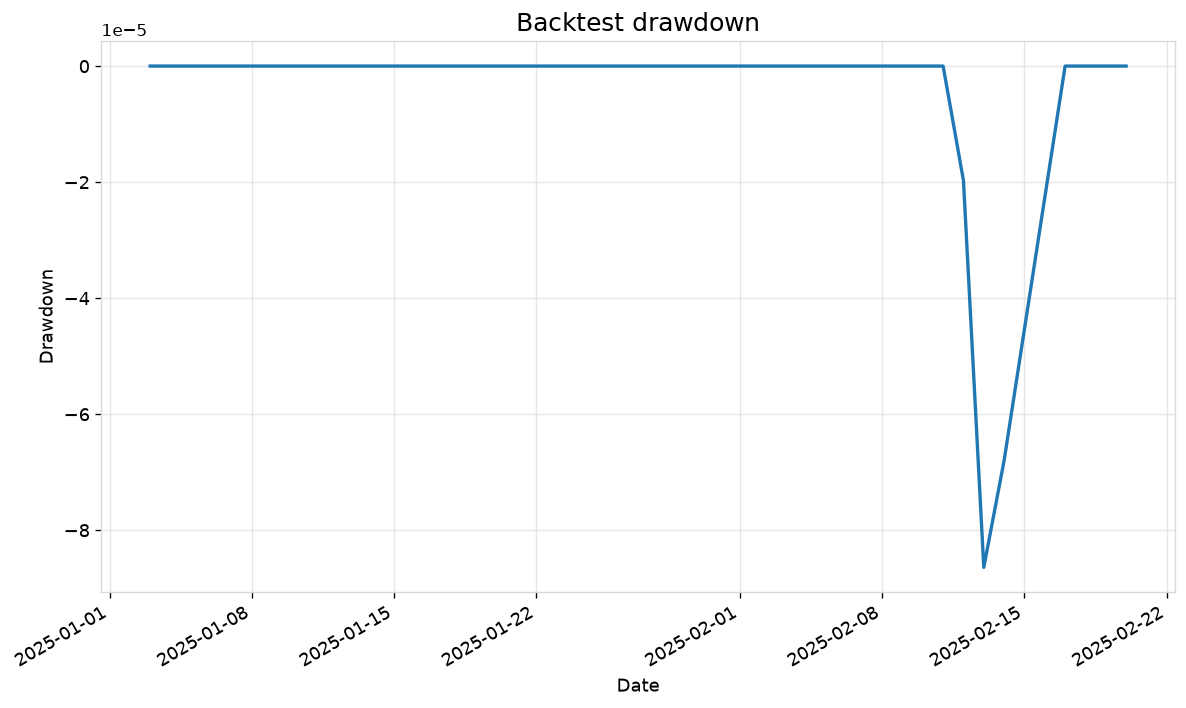
| 0 | 2025-02-12 | 2025-02-13 | 2025-02-17 | -0.000086 | 3 | 2 |
allocator_backtest.contribution_summary()
| total_return_contribution | absolute_return_contribution | contribution_share | |
|---|---|---|---|
| ALPHA | 0.026473 | 0.042736 | 0.476776 |
| BETA | 0.019862 | 0.035834 | 0.357719 |
| GAMMA | 0.009190 | 0.026807 | 0.165504 |
allocator_backtest.trade_summary()
| turnover | transaction_cost | largest_buy | largest_sell | |
|---|---|---|---|---|
| 2025-01-03 | 0.000000 | 0.000000 | 0.00000 | 0.000000 |
| 2025-02-03 | 0.490179 | 31.700561 | 0.24509 | -0.154315 |
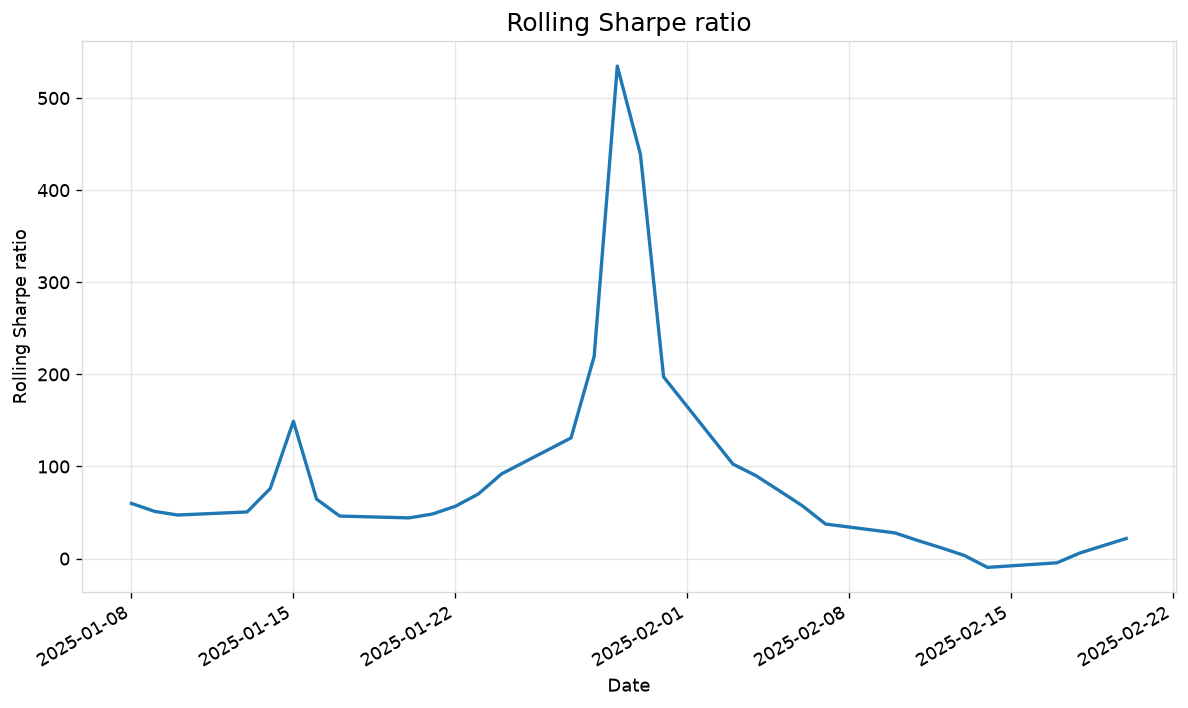
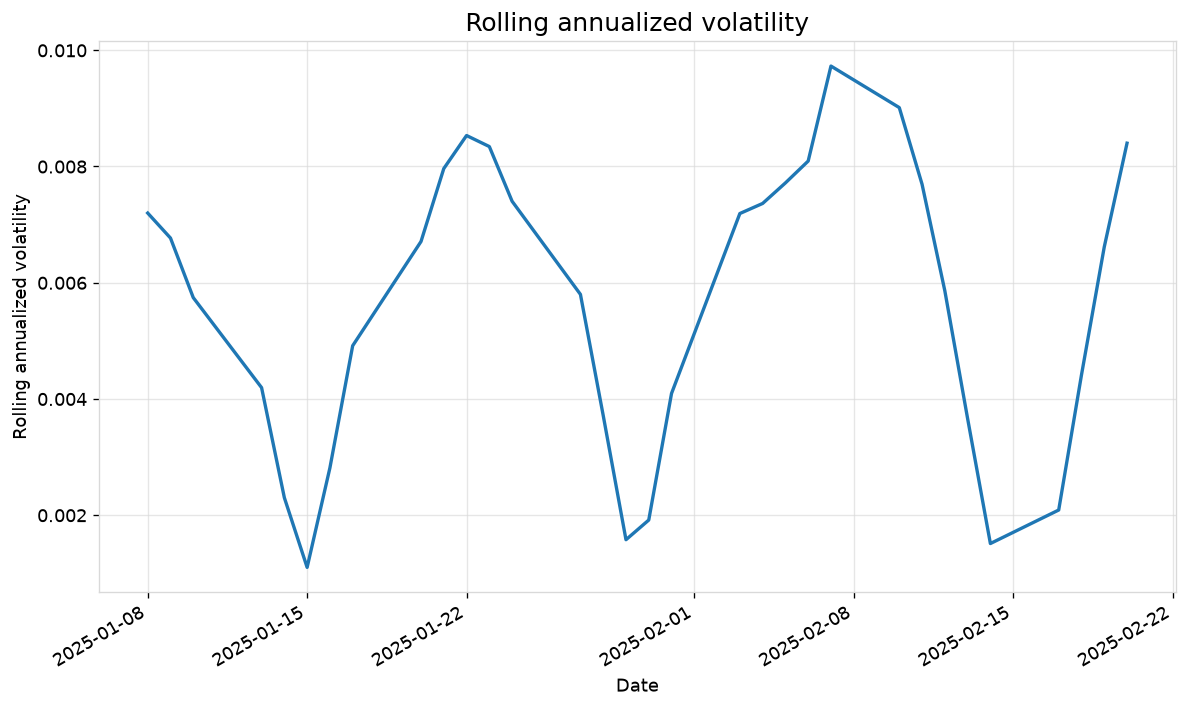
allocator_backtest.rolling_metrics(window=4).tail()
| annualized_return | annualized_volatility | sharpe_ratio | sortino_ratio | max_drawdown | tracking_error | |
|---|---|---|---|---|---|---|
| 2025-02-14 | 0.005455 | 0.001512 | -9.622288 | NaN | -0.000086 | 0.002771 |
| 2025-02-17 | 0.010272 | 0.002088 | -4.658105 | NaN | -0.000086 | 0.002260 |
| 2025-02-18 | 0.046627 | 0.004413 | 6.033808 | NaN | -0.000086 | 0.001370 |
| 2025-02-19 | 0.112237 | 0.006615 | 13.943082 | NaN | -0.000068 | 0.000706 |
| 2025-02-20 | 0.202652 | 0.008401 | 21.741489 | NaN | 0.000000 | 0.001874 |
4. Visualizations
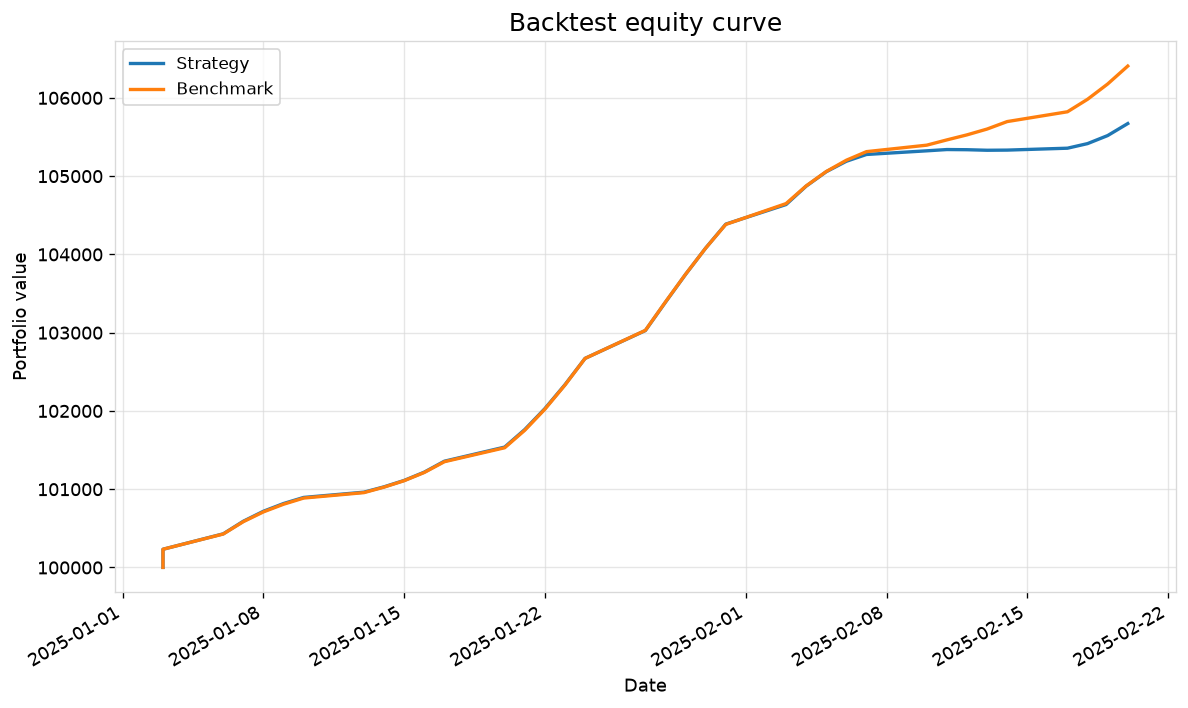
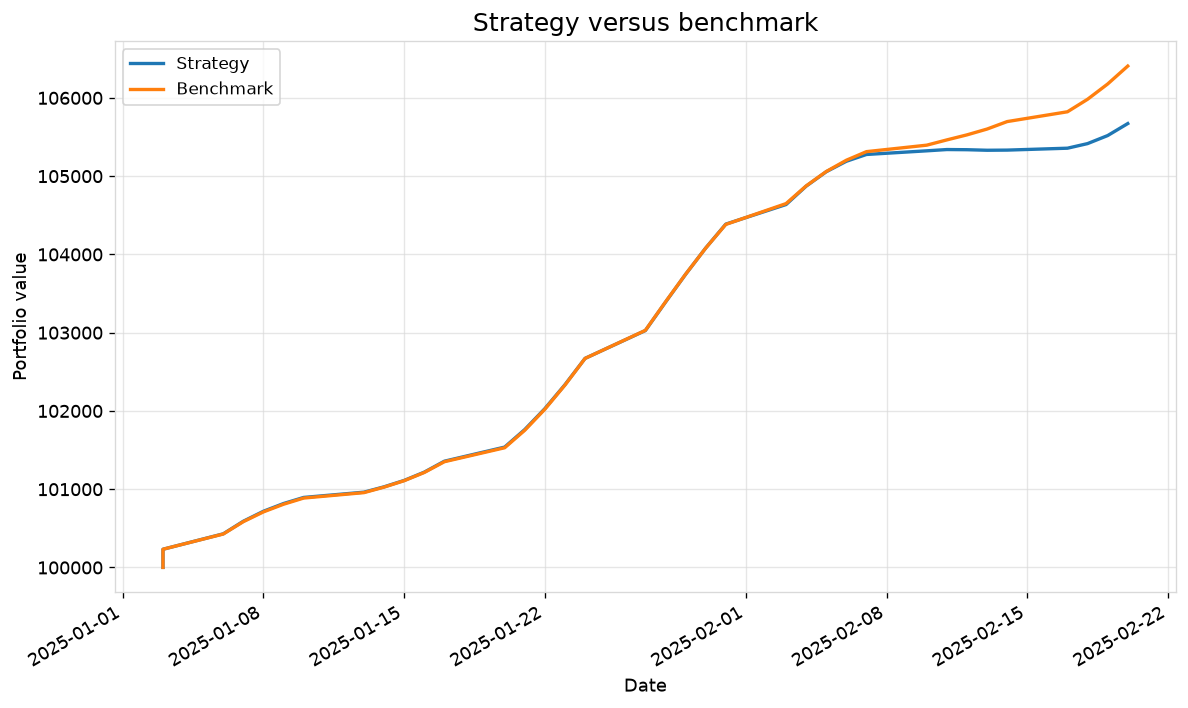
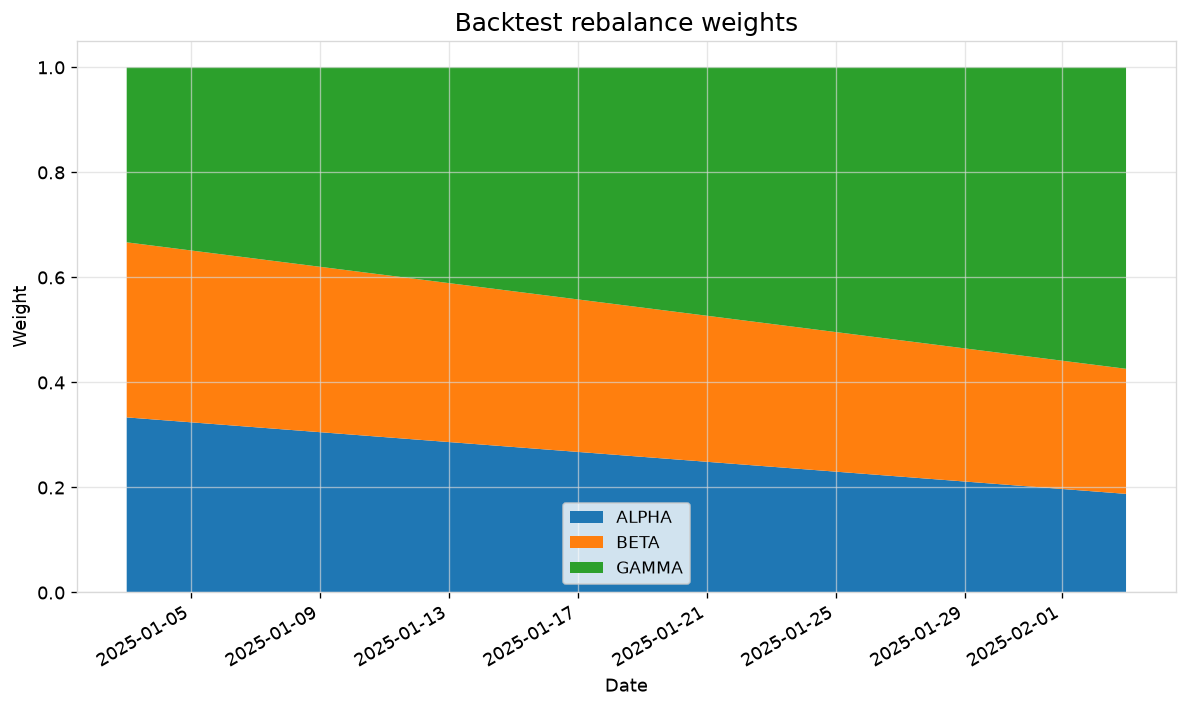
Equity curve, benchmark comparison, drawdown, weights, turnover, transaction costs, rolling Sharpe/volatility, a calendar return heatmap, contribution, and trade-weight charts.
try:
    figures = {
        "equity_curve": allocator_backtest.visualize(chart="equity_curve"),
        "benchmark": allocator_backtest.visualize(chart="benchmark"),
        "drawdown": allocator_backtest.visualize(chart="drawdown"),
        "weights": allocator_backtest.visualize(chart="weights"),
        "turnover": allocator_backtest.visualize(chart="turnover"),
        "transaction_costs": allocator_backtest.visualize(chart="transaction_costs"),
        "rolling_sharpe": allocator_backtest.visualize(chart="rolling_sharpe", rolling_window=4),
        "rolling_volatility": allocator_backtest.visualize(
            chart="rolling_volatility", rolling_window=4
        ),
        "return_heatmap": allocator_backtest.visualize(chart="return_heatmap"),
        "contributions": allocator_backtest.visualize(chart="contributions"),
        "trade_weights": allocator_backtest.visualize(chart="trade_weights"),
    }
    print(f"Created {len(figures)} figures: {list(figures)}")
except VisualizationError as exc:
    print(f"Visualization skipped (optional dependency missing): {exc}")
Created 11 figures: ['equity_curve', 'benchmark', 'drawdown', 'weights', 'turnover', 'transaction_costs', 'rolling_sharpe', 'rolling_volatility', 'return_heatmap', 'contributions', 'trade_weights']
Takeaway
Backtests here are deterministic, close-to-close simulations. They do
not model intraday execution, taxes, financing, or market impact beyond
the explicit slippage parameter — treat results as directional research,
not a live-trading guarantee. See docs/domains/assumptions.rst for the
full list of backtest failure modes.