Listed Option-Chain Analytics
OptionChainAnalytics connects a normalized listed option chain to
implied-volatility, liquidity, and model-comparison diagnostics: smiles,
surfaces, skew, term structure, rich/cheap tables, and open-interest
heatmaps. This notebook uses a deterministic offline provider so it runs
without network access.
Sections:
Build a deterministic option-chain analytics object
IV smile, skew, term structure, rich/cheap, open interest
Visualizations
Setup
import abaquant
print(f"AbaQuant version: {abaquant.__version__}")
AbaQuant version: 1.0.0rc1
import pandas as pd

from abaquant.marketdata import get_ticker
from abaquant.visualization import VisualizationError
class DeterministicMarketDataProvider:
    """Offline provider with a synthetic three-expiry option chain."""

    name = "deterministic-example"

    def fast_info(self, symbol):
        return {"lastPrice": 100.0}

    def info(self, symbol):
        return {"currency": "USD", "marketCap": 600.0, "symbol": symbol}

    def history(self, symbol, **kwargs):
        import numpy as np
        dates = pd.date_range("2025-01-02", periods=36, freq="B")
        return pd.DataFrame({"Close": 100.0 + np.linspace(0, 9, len(dates))}, index=dates)

    def history_many(self, symbols, **kwargs):
        return self.history(None).reindex(columns=list(symbols), method="nearest")

    def option_expirations(self, symbol):
        return ["2027-01-15", "2027-06-18", "2028-01-21"]

    def option_chain(self, symbol, expiry):
        shift = {"2027-01-15": 0.00, "2027-06-18": 0.025, "2028-01-21": 0.045}.get(expiry, 0.0)
        strikes = [80.0, 90.0, 100.0, 110.0, 120.0]
        calls = pd.DataFrame({
            "contractSymbol": [f"{symbol}C{int(k)}" for k in strikes], "strike": strikes,
            "lastPrice": [22.0, 14.5, 8.0, 4.5, 2.4],
            "bid": [21.5, 14.0, 7.6, 4.1, 2.0], "ask": [22.5, 15.0, 8.4, 4.9, 2.8],
            "impliedVolatility": [0.31 + shift, 0.27 + shift, 0.23 + shift, 0.25 + shift, 0.29 + shift],
            "openInterest": [120, 240, 520, 310, 180], "volume": [12, 28, 65, 34, 16],
        })
        puts = pd.DataFrame({
            "contractSymbol": [f"{symbol}P{int(k)}" for k in strikes], "strike": strikes,
            "lastPrice": [2.2, 4.1, 7.8, 13.9, 21.0],
            "bid": [1.9, 3.8, 7.4, 13.4, 20.4], "ask": [2.5, 4.4, 8.2, 14.4, 21.6],
            "impliedVolatility": [0.35 + shift, 0.30 + shift, 0.24 + shift, 0.26 + shift, 0.32 + shift],
            "openInterest": [210, 330, 610, 270, 155], "volume": [18, 36, 70, 29, 14],
        })
        return calls, puts

    def income_statement(self, symbol, *, period="annual"):
        return pd.DataFrame({"2025-12-31": {"Total Revenue": 450.0}})

    def balance_sheet(self, symbol, *, period="annual"):
        return pd.DataFrame({"2025-12-31": {"Total Debt": 120.0}})

    def cash_flow_statement(self, symbol, *, period="annual"):
        return pd.DataFrame({"2025-12-31": {"Operating Cash Flow": 70.0}})
1. Build a deterministic option-chain analytics object
provider = DeterministicMarketDataProvider()
ticker = get_ticker("DEMO", provider=provider, financial_cache="memory")
analytics = ticker.options.analytics(expiry="2027-01-15")
2. IV smile, skew, term structure, rich/cheap, open interest
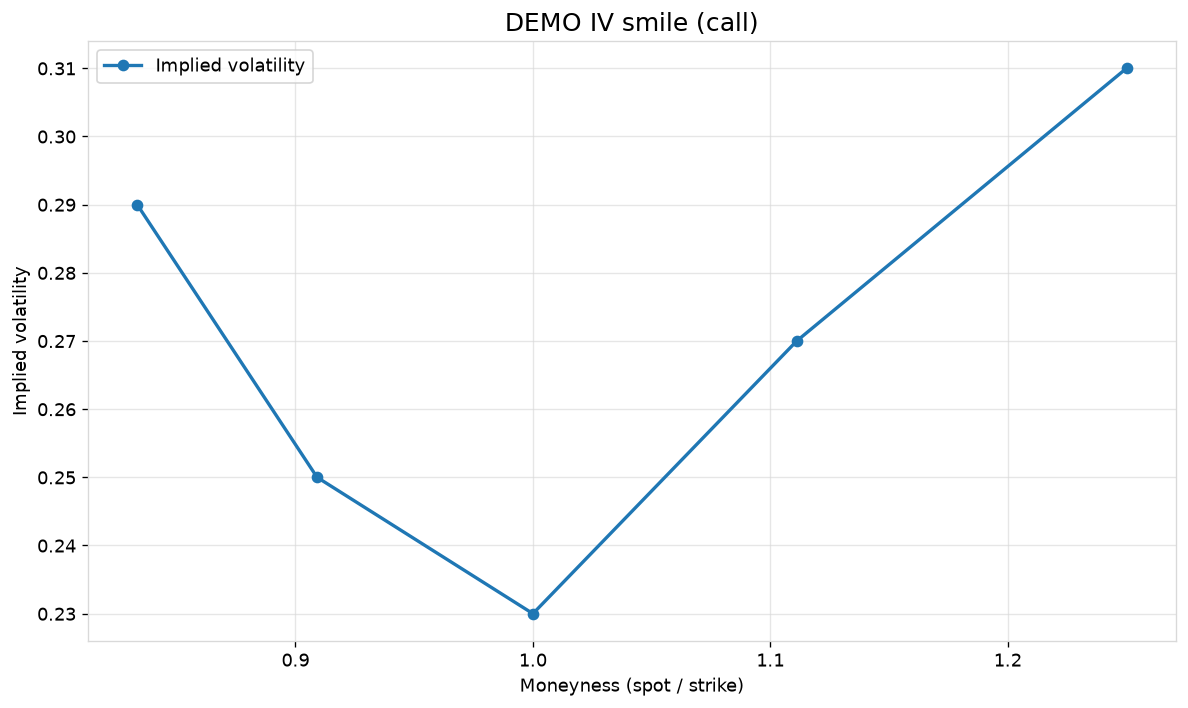
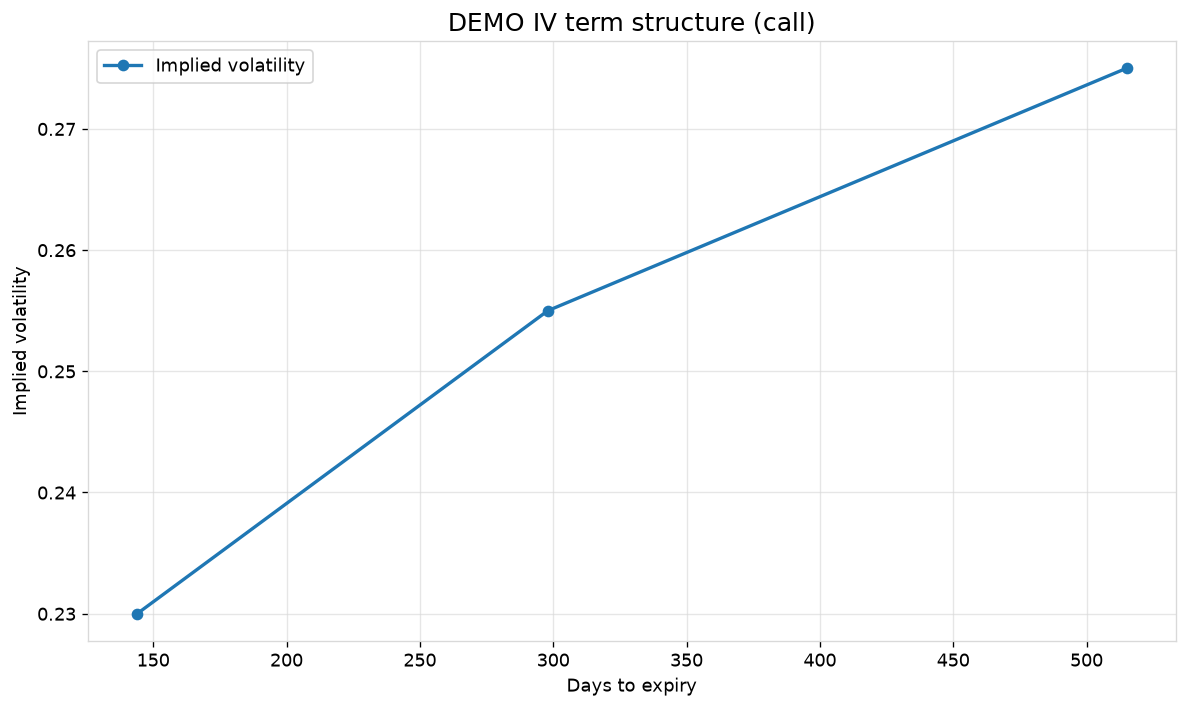
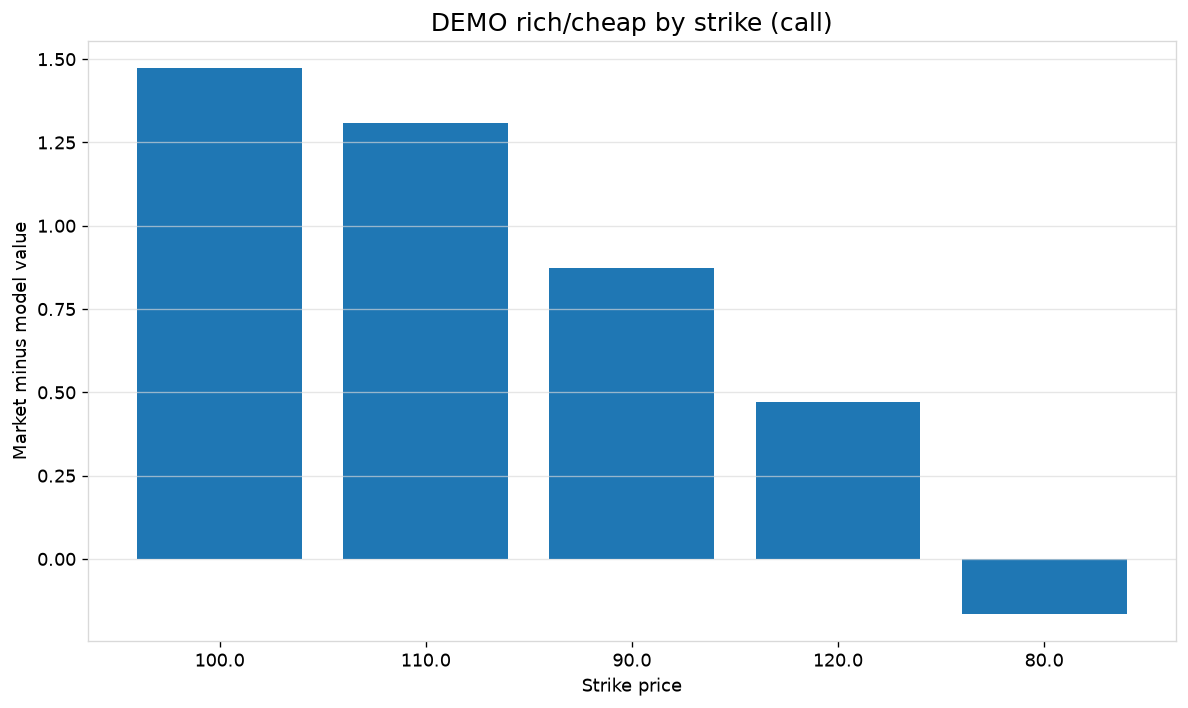
iv_smile— implied volatility by strike/moneyness for one expiryskew— linear IV skew against log-moneynessterm_structure— implied volatility across expirations at a fixed strikerich_cheap_table— listed prices vs. a chosen model (default BSM)open_interest_grid— open interest by expiry, strike, and option type
call_smile = analytics.iv_smile(option_type="call")
put_skew = analytics.skew(option_type="put")
term_structure = analytics.term_structure(
    option_type="call", strike=100.0, expiries=["2027-01-15", "2027-06-18", "2028-01-21"]
)
rich_cheap = analytics.rich_cheap_table(model="bsm", risk_free_rate=0.04, option_type="call")
open_interest = analytics.open_interest_grid(
    option_type="put", expiries=["2027-01-15", "2027-06-18", "2028-01-21"]
)

print(f"Call smile rows:            {len(call_smile)}")
print(f"Put skew slope:             {put_skew.slope:.6f}")
print(f"Term-structure rows:        {len(term_structure)}")
print(f"Largest rich strike:        {float(rich_cheap.iloc[0]['strike'])}")
print(f"Total put open interest:    {float(open_interest['open_interest'].sum())}")
Call smile rows:            5
Put skew slope:             0.113225
Term-structure rows:        3
Largest rich strike:        100.0
Total put open interest:    4725.0
rich_cheap.head()
| expiry | option_type | strike | moneyness | market_price | implied_volatility | model_volatility | model_value | rich_cheap | rich_cheap_pct | rich_cheap_label | open_interest | volume | |
|---|---|---|---|---|---|---|---|---|---|---|---|---|---|
| 0 | 2027-01-15 | call | 100.0 | 1.000000 | 8.0 | 0.23 | 0.23 | 6.527586 | 1.472414 | 0.225568 | rich | 520 | 65 |
| 1 | 2027-01-15 | call | 110.0 | 0.909091 | 4.5 | 0.25 | 0.25 | 3.192121 | 1.307879 | 0.409721 | rich | 310 | 34 |
| 2 | 2027-01-15 | call | 90.0 | 1.111111 | 14.5 | 0.27 | 0.27 | 13.628060 | 0.871940 | 0.063981 | rich | 240 | 28 |
| 3 | 2027-01-15 | call | 120.0 | 0.833333 | 2.4 | 0.29 | 0.29 | 1.929744 | 0.470256 | 0.243688 | rich | 180 | 16 |
| 4 | 2027-01-15 | call | 80.0 | 1.250000 | 22.0 | 0.31 | 0.31 | 22.164575 | -0.164575 | -0.007425 | cheap | 120 | 12 |
3. Visualizations
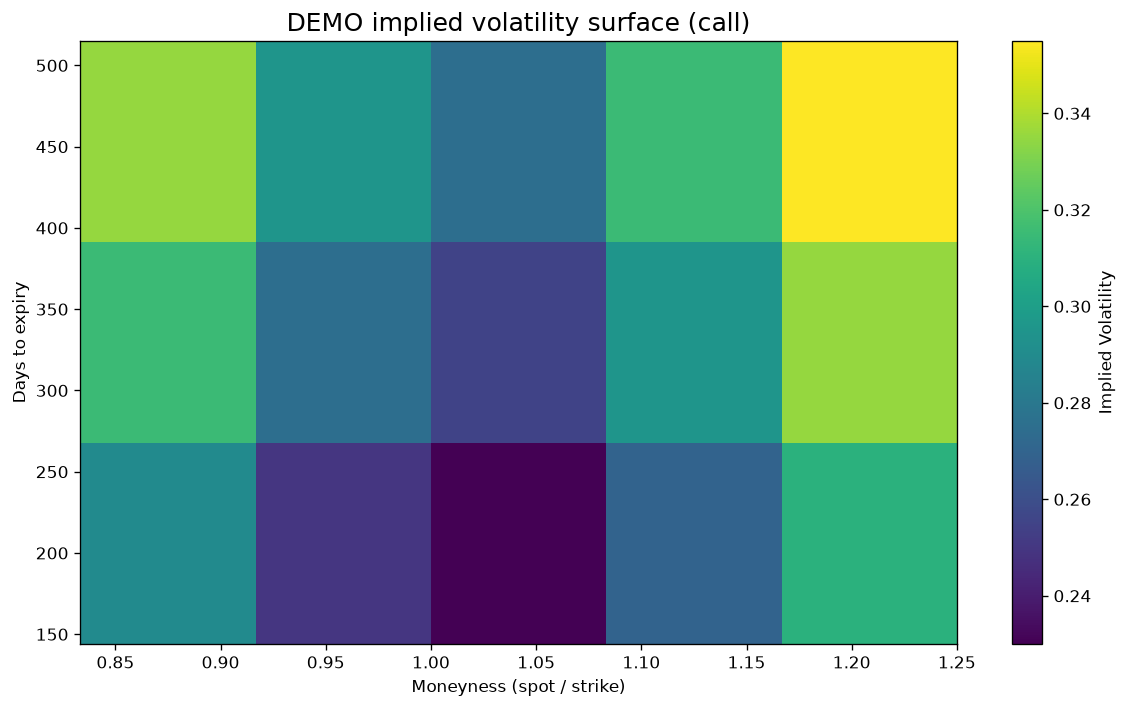
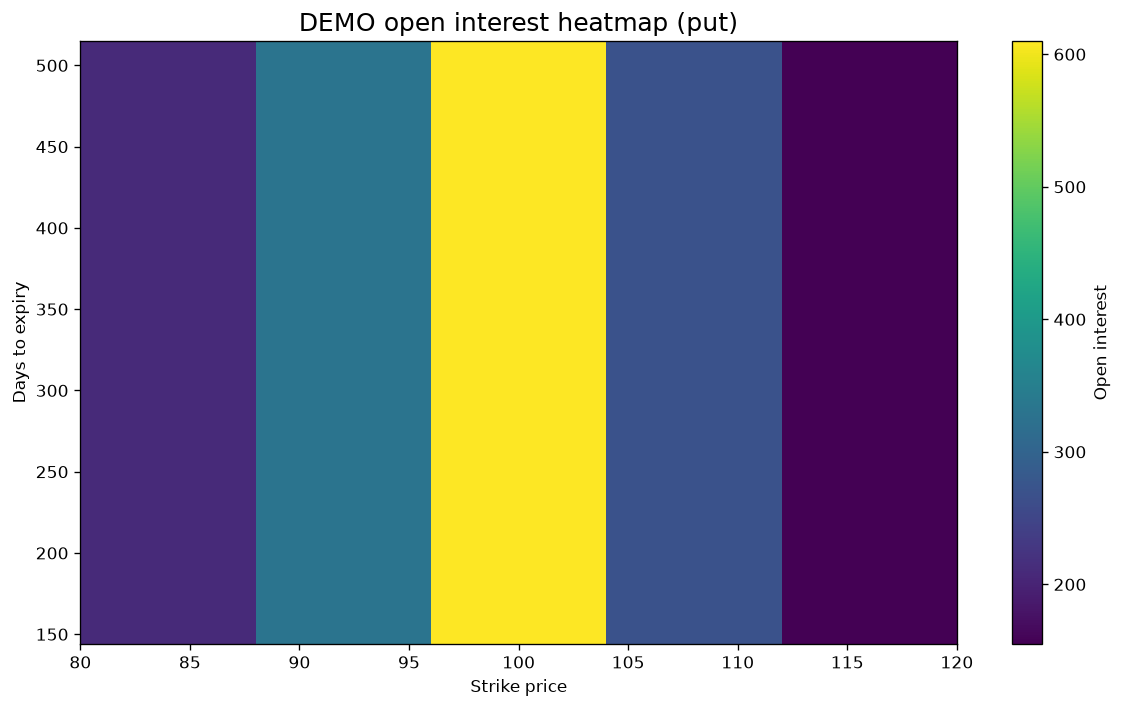
IV smile, IV surface, term structure, rich/cheap, and an open-interest heatmap.
try:
    figures = {
        "iv_smile": analytics.visualize(chart="iv_smile", option_type="call"),
        "iv_surface": analytics.visualize(chart="iv_surface", option_type="call"),
        "term_structure": analytics.visualize(
            chart="term_structure", option_type="call", strike=100.0
        ),
        "rich_cheap": analytics.visualize(
            chart="rich_cheap", option_type="call", risk_free_rate=0.04
        ),
        "open_interest_heatmap": analytics.visualize(
            chart="open_interest_heatmap", option_type="put"
        ),
    }
    print(f"Created {len(figures)} figures: {list(figures)}")
except VisualizationError as exc:
    print(f"Visualization skipped (optional dependency missing): {exc}")
Created 5 figures: ['iv_smile', 'iv_surface', 'term_structure', 'rich_cheap', 'open_interest_heatmap']
Takeaway
OptionChainAnalytics is provider-independent: swap the deterministic
provider here for Yahoo or another live source and every method above keeps
working unchanged. See notebook 22 — Derivative Calibration for fitting
BSM/SABR/Heston parameters directly to a chain like this one.