Composable Option Strategy Builder
OptionStrategy lets you assemble multi-leg option strategies leg by leg
(buy_call, sell_call, buy_put, sell_put, buy_underlying,
sell_underlying), or reach for predefined constructors like spreads,
straddles, strangles, condors, and butterflies.
Scope note: this is a static expiration-analysis tool. It does not model early exercise, margin, assignment, funding, slippage, taxes, or dynamic hedging.
Sections:
Build a strategy leg by leg
Compare predefined strategy constructors
Payoff profile table
Visualizations
Setup
import abaquant
print(f"AbaQuant version: {abaquant.__version__}")
AbaQuant version: 1.0.0rc1
from abaquant.derivatives import OptionStrategy
from abaquant.visualization import VisualizationError
1. Build a strategy leg by leg
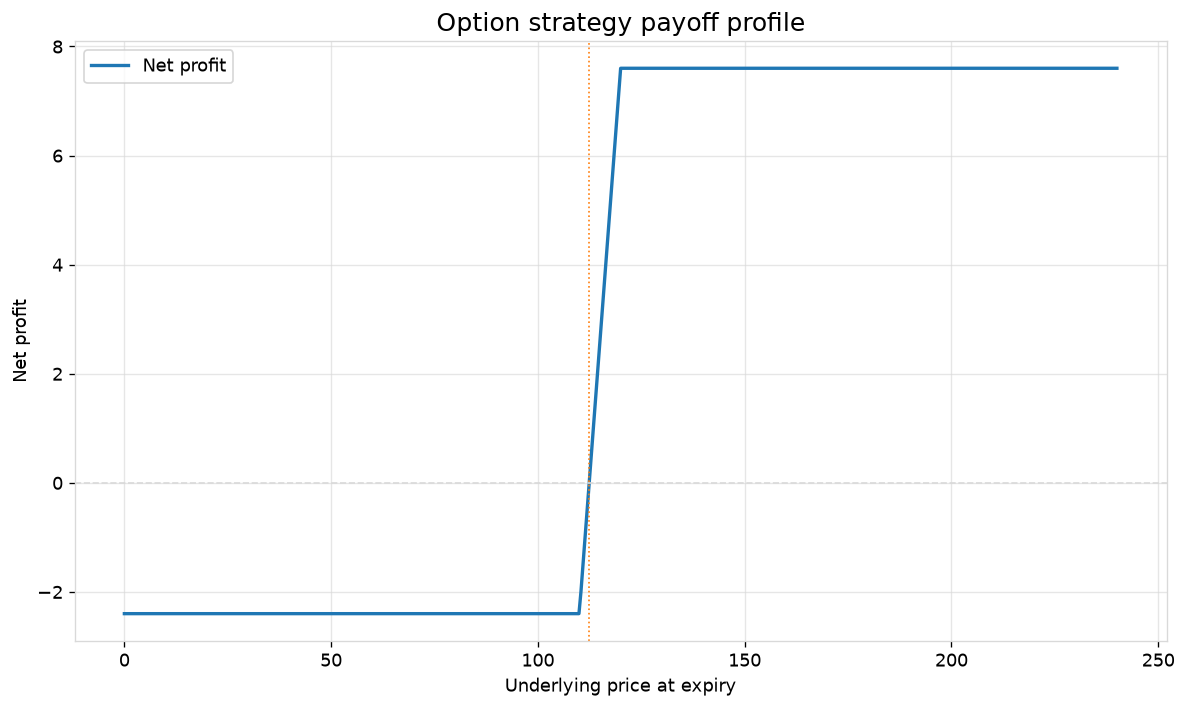
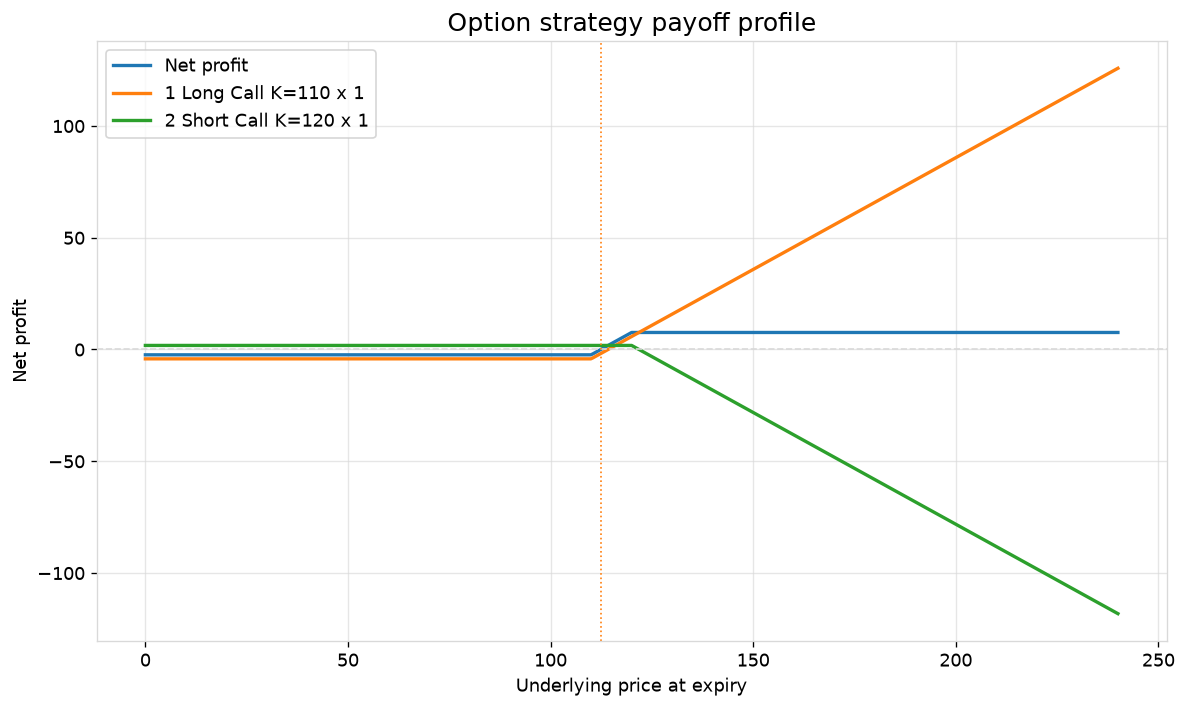
A debit call spread: buy the 110 call, sell the 120 call.
spread = OptionStrategy().buy_call(strike=110.0, premium=4.2).sell_call(strike=120.0, premium=1.8)

diagnostics = {
    "profit_at_125": spread.payoff(spot_price=125.0),
    "gross_payoff_at_125": spread.payoff(spot_price=125.0, include_premium=False),
    "net_inception_cost": spread.net_inception_cost(),
    "max_profit": spread.max_profit(),
    "max_loss": spread.max_loss(),
    "break_even_points": spread.break_even_points(),
}
for key, value in diagnostics.items():
    print(f"{key:22s}: {value}")
profit_at_125         : 7.6
gross_payoff_at_125   : 10.0
net_inception_cost    : 2.4000000000000004
max_profit            : 7.6
max_loss              : -2.4000000000000004
break_even_points     : [112.4]
2. Compare predefined strategy constructors
Bull call spread, protective put, straddle, strangle, iron condor, and butterfly — each built from one class-method call.
strategies = {
    "bull_call_spread": OptionStrategy.bull_call_spread(
        lower_strike=110.0, upper_strike=120.0, lower_premium=4.2, upper_premium=1.8
    ),
    "protective_put": OptionStrategy.protective_put(
        underlying_entry_price=100.0, put_strike=95.0, put_premium=3.0
    ),
    "straddle": OptionStrategy.straddle(strike=100.0, call_premium=5.0, put_premium=4.5),
    "strangle": OptionStrategy.strangle(
        put_strike=95.0, call_strike=105.0, put_premium=3.0, call_premium=3.4
    ),
    "iron_condor": OptionStrategy.iron_condor(
        lower_put_strike=85.0, short_put_strike=95.0, short_call_strike=105.0,
        upper_call_strike=115.0, lower_put_premium=1.0, short_put_premium=3.2,
        short_call_premium=3.0, upper_call_premium=1.1,
    ),
    "butterfly": OptionStrategy.butterfly(
        lower_strike=90.0, middle_strike=100.0, upper_strike=110.0,
        lower_premium=12.0, middle_premium=6.0, upper_premium=2.0,
    ),
}

comparison = {
    name: {
        "legs": len(strategy.legs),
        "max_profit": strategy.max_profit(),
        "max_loss": strategy.max_loss(),
        "break_even_points": strategy.break_even_points(),
    }
    for name, strategy in strategies.items()
}
import pandas as pd
pd.DataFrame(comparison).T
| legs | max_profit | max_loss | break_even_points | |
|---|---|---|---|---|
| bull_call_spread | 2 | 7.6 | -2.4 | [112.4] |
| protective_put | 2 | inf | -8.0 | [103.0] |
| straddle | 2 | inf | -9.5 | [90.5, 109.5] |
| strangle | 2 | inf | -6.4 | [88.6, 111.4] |
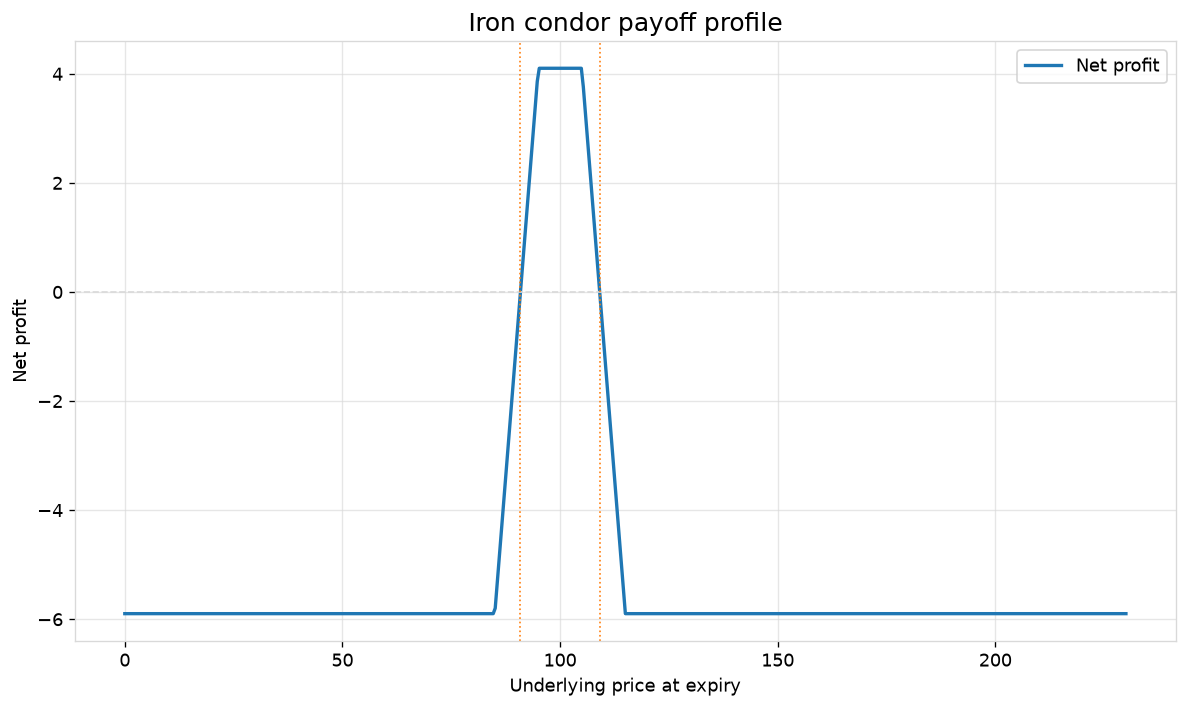
| iron_condor | 4 | 4.1 | -5.9 | [90.9, 109.1] |
| butterfly | 3 | 8.0 | -2.0 | [92.0, 108.0] |
3. Payoff profile table
Evaluate the bull call spread across a handful of terminal spot prices.
profile = spread.profile(spot_prices=[90.0, 110.0, 112.4, 120.0, 130.0])
profile[["spot_price", "gross_payoff", "net_profit"]]
| spot_price | gross_payoff | net_profit | |
|---|---|---|---|
| 0 | 90.0 | 0.0 | -2.400000e+00 |
| 1 | 110.0 | 0.0 | -2.400000e+00 |
| 2 | 112.4 | 2.4 | 5.329071e-15 |
| 3 | 120.0 | 10.0 | 7.600000e+00 |
| 4 | 130.0 | 10.0 | 7.600000e+00 |
4. Visualizations
Aggregate payoff, per-leg components, and the iron condor payoff.
try:
    figures = {
        "payoff": spread.visualize(chart="payoff"),
        "components": spread.visualize(chart="components"),
        "iron_condor": strategies["iron_condor"].visualize(chart="payoff"),
    }
    print(f"Created {len(figures)} figures: {list(figures)}")
except VisualizationError as exc:
    print(f"Visualization skipped (optional dependency missing): {exc}")
Created 3 figures: ['payoff', 'components', 'iron_condor']
Takeaway
Predefined constructors cover the common named strategies; add_leg()-style
chaining handles anything custom. Combine .profile() with .visualize(chart="components")
to see how each leg contributes to the overall payoff shape.