Applied Market-Data Workflows
Two compact, applied market-data workflows using an offline deterministic provider:
Single-ticker options workflow — quotes, listed option chains, BSM pricing, and Greeks for one ticker.
Multi-ticker universe workflow — aligned prices/returns and a maximum-Sharpe portfolio across a small universe.
Both reuse the same deterministic provider pattern from notebook 06 — Market Data (Offline).
Setup
import abaquant
print(f"AbaQuant version: {abaquant.__version__}")
AbaQuant version: 1.0.0rc1
import pandas as pd

from abaquant.marketdata import get_ticker, get_tickers
from abaquant.visualization import VisualizationError


class DeterministicMarketDataProvider:
    """Offline provider reused across both workflows below."""

    name = "deterministic-example"

    def fast_info(self, symbol):
        return {"lastPrice": 105.0}

    def info(self, symbol):
        return {"currency": "USD", "marketCap": 600.0, "symbol": symbol}

    def history(self, symbol, **kwargs):
        import numpy as np
        dates = pd.date_range("2025-01-02", periods=24, freq="B")
        return pd.DataFrame({"Close": 100.0 + np.linspace(0, 8, len(dates))}, index=dates)

    def history_many(self, symbols, **kwargs):
        import numpy as np
        dates = pd.date_range("2025-01-02", periods=24, freq="B")
        data = {s: 100.0 + i * 5 + np.linspace(0, 8, len(dates)) for i, s in enumerate(symbols)}
        return pd.DataFrame(data, index=dates)

    def option_expirations(self, symbol):
        return ["2027-01-15"]

    def option_chain(self, symbol, expiry):
        strikes = [80.0, 90.0, 100.0, 110.0, 120.0]
        calls = pd.DataFrame({
            "contractSymbol": [f"{symbol}C{int(k)}" for k in strikes], "strike": strikes,
            "lastPrice": [22.0, 14.5, 8.0, 4.5, 2.4], "bid": [21.5, 14.0, 7.6, 4.1, 2.0],
            "ask": [22.5, 15.0, 8.4, 4.9, 2.8],
            "impliedVolatility": [0.31, 0.27, 0.23, 0.25, 0.29],
            "openInterest": [120, 240, 520, 310, 180], "volume": [12, 28, 65, 34, 16],
        })
        puts = pd.DataFrame({
            "contractSymbol": [f"{symbol}P{int(k)}" for k in strikes], "strike": strikes,
            "lastPrice": [2.2, 4.1, 7.8, 13.9, 21.0], "bid": [1.9, 3.8, 7.4, 13.4, 20.4],
            "ask": [2.5, 4.4, 8.2, 14.4, 21.6],
            "impliedVolatility": [0.35, 0.30, 0.24, 0.26, 0.32],
            "openInterest": [210, 330, 610, 270, 155], "volume": [18, 36, 70, 29, 14],
        })
        return calls, puts

    def income_statement(self, symbol, *, period="annual"):
        return pd.DataFrame({"2025-12-31": {"Total Revenue": 450.0}})

    def balance_sheet(self, symbol, *, period="annual"):
        return pd.DataFrame({"2025-12-31": {"Total Debt": 120.0}})

    def cash_flow_statement(self, symbol, *, period="annual"):
        return pd.DataFrame({"2025-12-31": {"Operating Cash Flow": 70.0}})
1. Single-ticker options workflow
Spot quote, listed expirations, one option chain, listed implied volatility, a BSM call price, and delta.
provider = DeterministicMarketDataProvider()
ticker = get_ticker("DEMO", provider=provider, financial_cache="memory")

option_workflow = {
    "spot": ticker.spot(),
    "expirations": ticker.options.expirations(),
    "chain_rows": len(ticker.options.chain(expiry="2027-01-15")),
    "listed_iv": ticker.options.listed_implied_volatility(strike=100.0, expiry="2027-01-15"),
    "bsm_call": ticker.options.bsm(
        strike=100.0, maturity=0.5, risk_free_rate=0.04, volatility=0.20
    ),
    "delta": ticker.options.greeks(
        strike=100.0, maturity=0.5, risk_free_rate=0.04, volatility=0.20
    )["delta"],
}
for key, value in option_workflow.items():
    print(f"{key:14s}: {value}")
spot          : 105.0
expirations   : ['2027-01-15']
chain_rows    : 10
listed_iv     : 0.23
bsm_call      : 9.87487438732785
delta         : 0.711280896917368
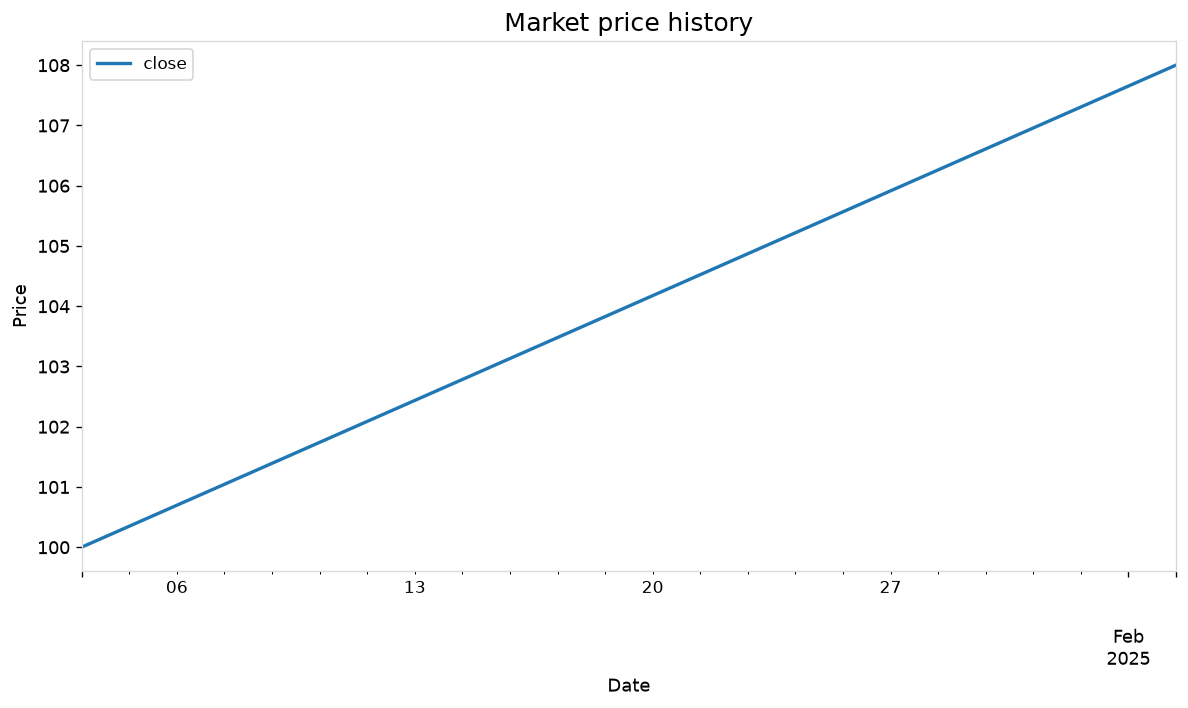
try:
    ticker.visualize(period="1mo")
except VisualizationError as exc:
    print(f"Visualization skipped (optional dependency missing): {exc}")
2. Multi-ticker universe workflow
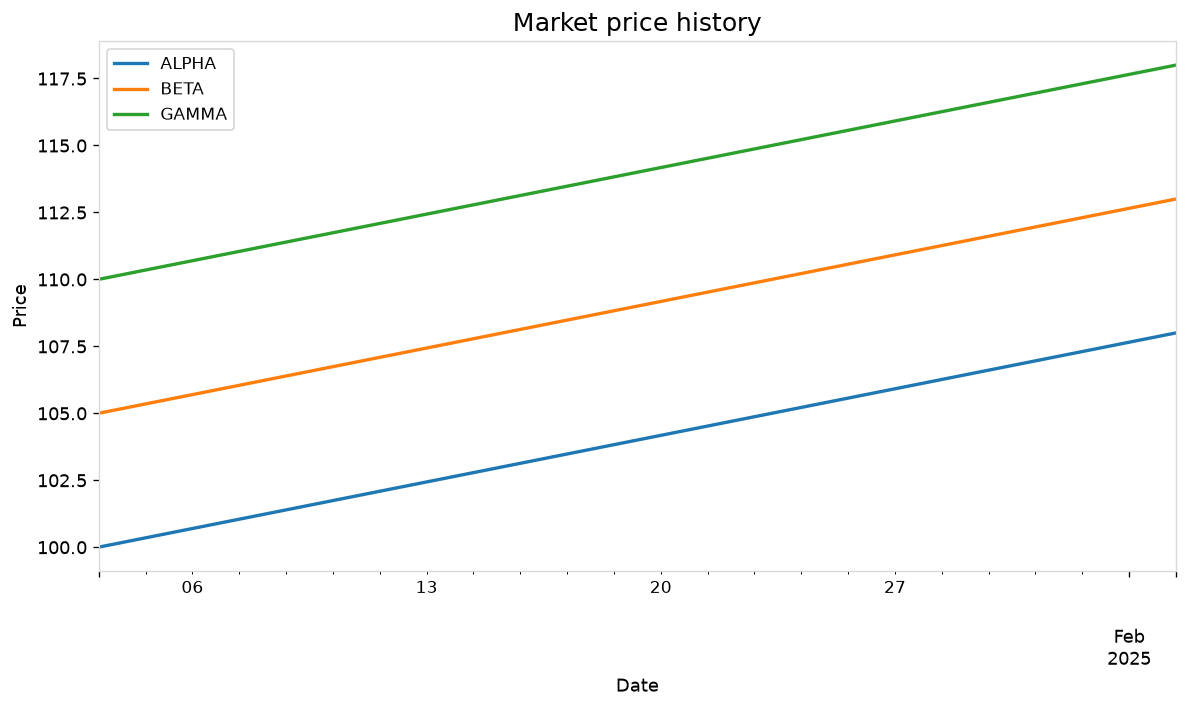
Aligned price/return panels, per-asset statistics, and a maximum-Sharpe portfolio across a three-asset universe.
universe = get_tickers(["ALPHA", "BETA", "GAMMA"], provider=provider)
portfolio = universe.portfolio.max_sharpe(period="1mo", risk_free_rate=0.02)

universe_workflow = {
    "symbols": universe.symbols,
    "price_shape": universe.history.prices(period="1mo").shape,
    "return_shape": universe.history.returns(period="1mo").shape,
    "statistics_rows": len(universe.statistics.summary(period="1mo")),
    "max_sharpe_alpha_weight": float(next(iter(portfolio.weights.values()))),
    "max_sharpe_ratio": portfolio.sharpe_ratio,
}
for key, value in universe_workflow.items():
    print(f"{key:24s}: {value}")
symbols                 : ('ALPHA', 'BETA', 'GAMMA')
price_shape             : (24, 3)
return_shape            : (23, 3)
statistics_rows         : 3
max_sharpe_alpha_weight : 0.0
max_sharpe_ratio        : 745.6999002212838
try:
    universe.visualize(period="1mo")
except VisualizationError as exc:
    print(f"Visualization skipped (optional dependency missing): {exc}")
Takeaway
These are the two smallest useful entry points into
abaquant.marketdata: one ticker for single-name option analytics, one
universe for cross-asset portfolio construction. Both are lazy — no data is
retrieved until you call a method like .spot() or .history.prices().